Fig. 18.
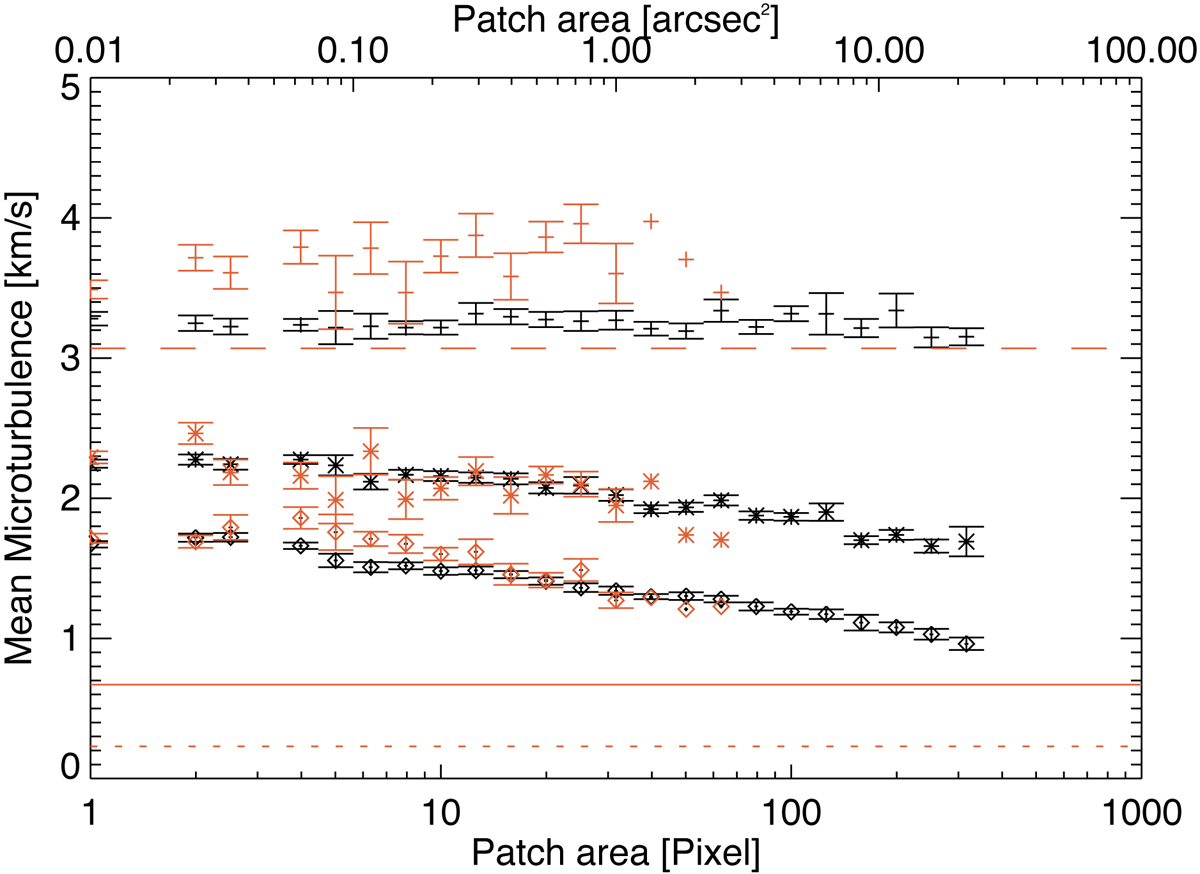
Relation between kG feature size and its internal mean micro turbulent velocity. The plus, star and diamond symbols indicate the log(τ) = 0, −0.8 and −2 layers respectively. The error bars denote the error in the mean. The black symbols refer to plage and the red to network areas. The dashed, solid, and dotted lines indicate the mean microturbulence in quiet Sun intergranular lanes at log(τ) = 0, −0.8 and −2, respectively. All the mean microturbulent velocities were calculated using ten logarithmic bins per decade of patch area.
Current usage metrics show cumulative count of Article Views (full-text article views including HTML views, PDF and ePub downloads, according to the available data) and Abstracts Views on Vision4Press platform.
Data correspond to usage on the plateform after 2015. The current usage metrics is available 48-96 hours after online publication and is updated daily on week days.
Initial download of the metrics may take a while.