Fig. 17.
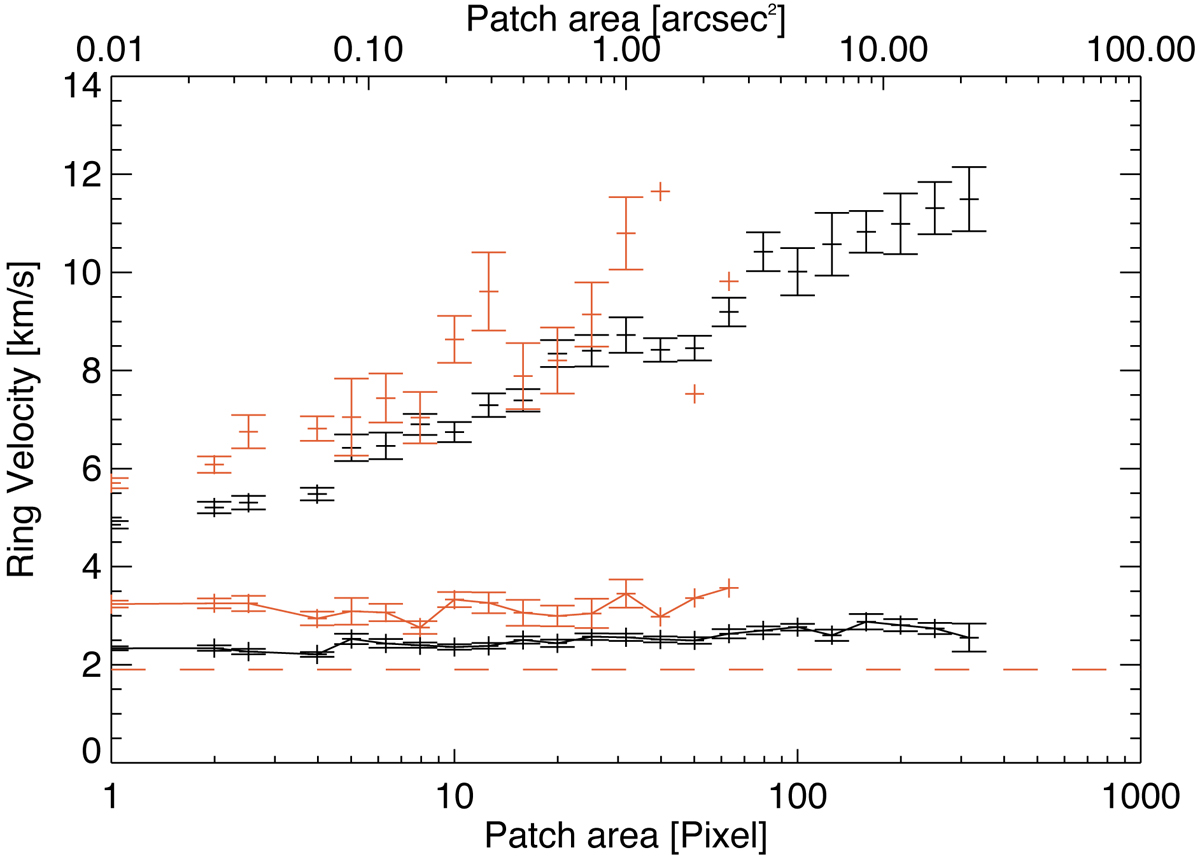
Relation between kG feature size and flows surrounding them. The solid black line displays the mean flow speeds in a one-pixel ring surrounding kG features at log(τ) = 0 in plage areas and the solid red line for network features. They are identical to the solid lines in Fig. 16. The black plus symbols indicate the fastest single pixel flows in a ring in plage areas whilst red plus symbols show the same in network areas. The red dashed line indicates the mean flow in quiet Sun intergranular lanes. The errors bars denote the error in the mean. All the mean LOS velocities were calculated using ten logarithmic bins per decade of patch area.
Current usage metrics show cumulative count of Article Views (full-text article views including HTML views, PDF and ePub downloads, according to the available data) and Abstracts Views on Vision4Press platform.
Data correspond to usage on the plateform after 2015. The current usage metrics is available 48-96 hours after online publication and is updated daily on week days.
Initial download of the metrics may take a while.