Free Access
Fig. 16.
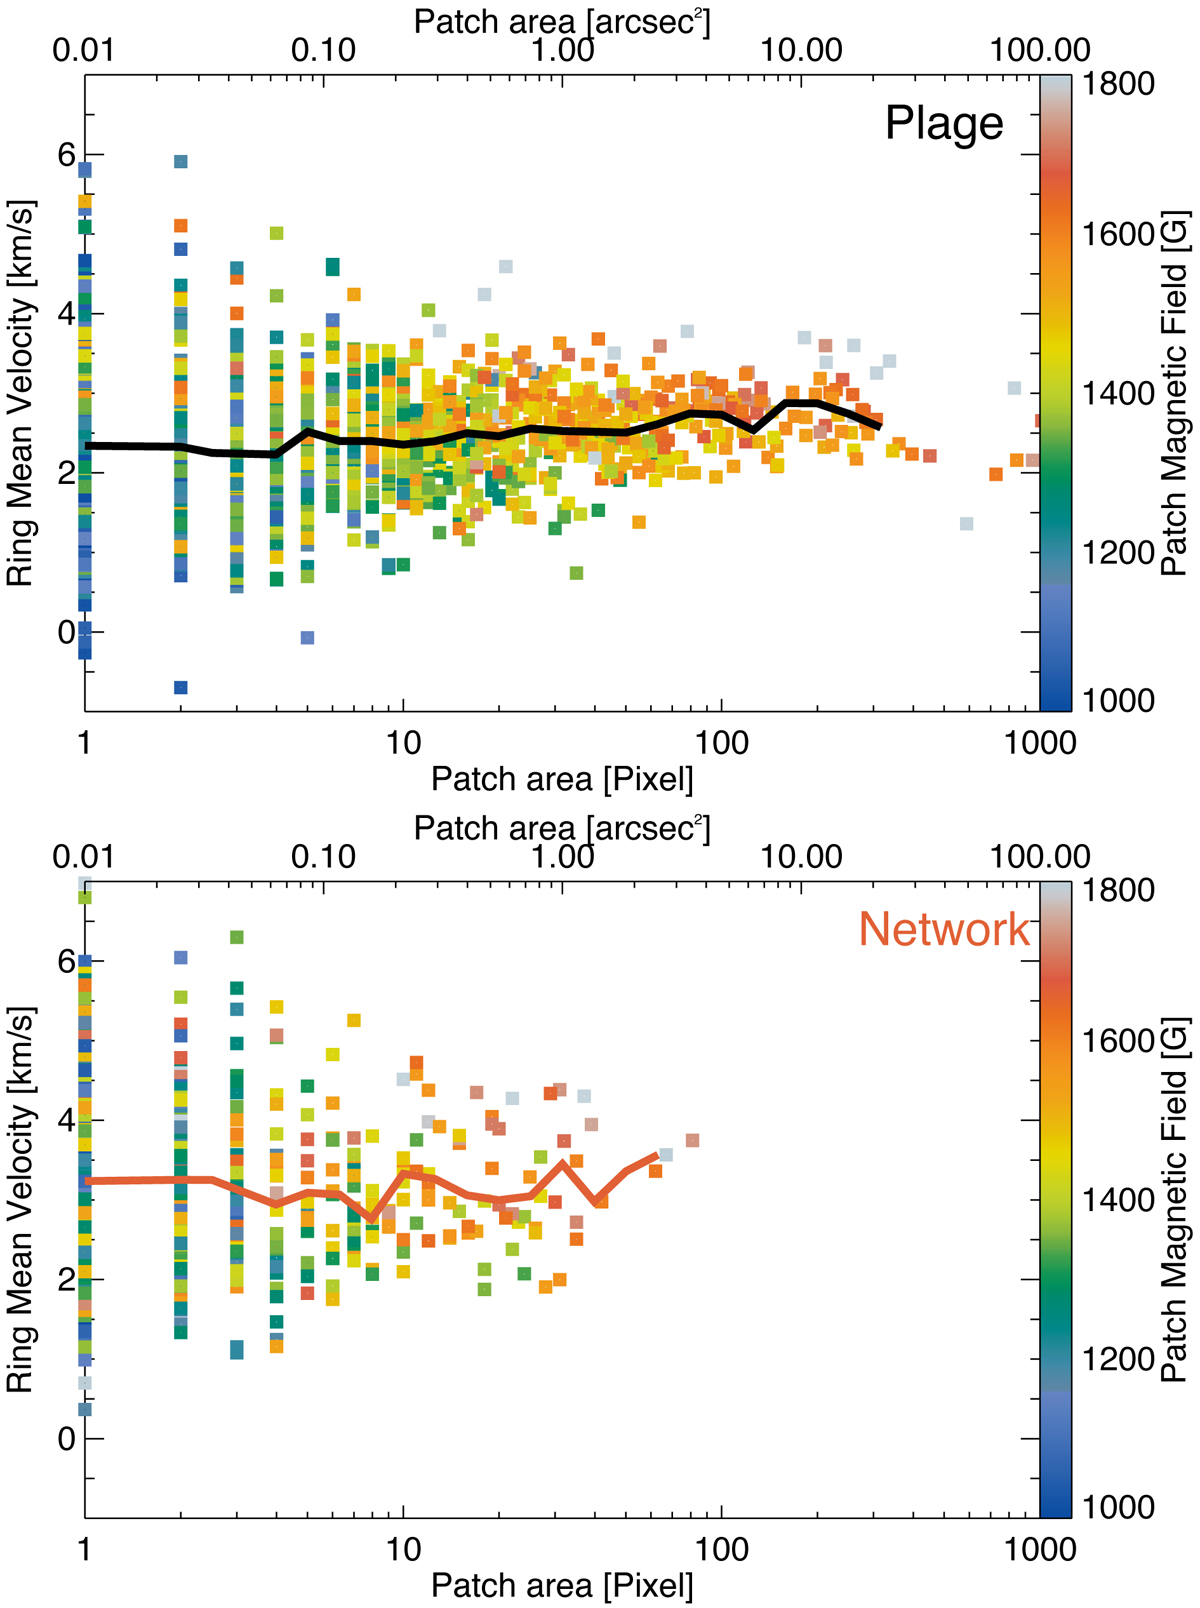
Scatterplot of patch areas of kG features and mean flow speeds at log(τ) = 0 in a one pixel-wide ring surrounding them for features in the plage, top, and the network, bottom. The solid lines indicate mean flow speeds. The ring mean LOS velocities were calculated using ten logarithmic bins per decade of patch area.
Current usage metrics show cumulative count of Article Views (full-text article views including HTML views, PDF and ePub downloads, according to the available data) and Abstracts Views on Vision4Press platform.
Data correspond to usage on the plateform after 2015. The current usage metrics is available 48-96 hours after online publication and is updated daily on week days.
Initial download of the metrics may take a while.