Free Access
Fig. 11.
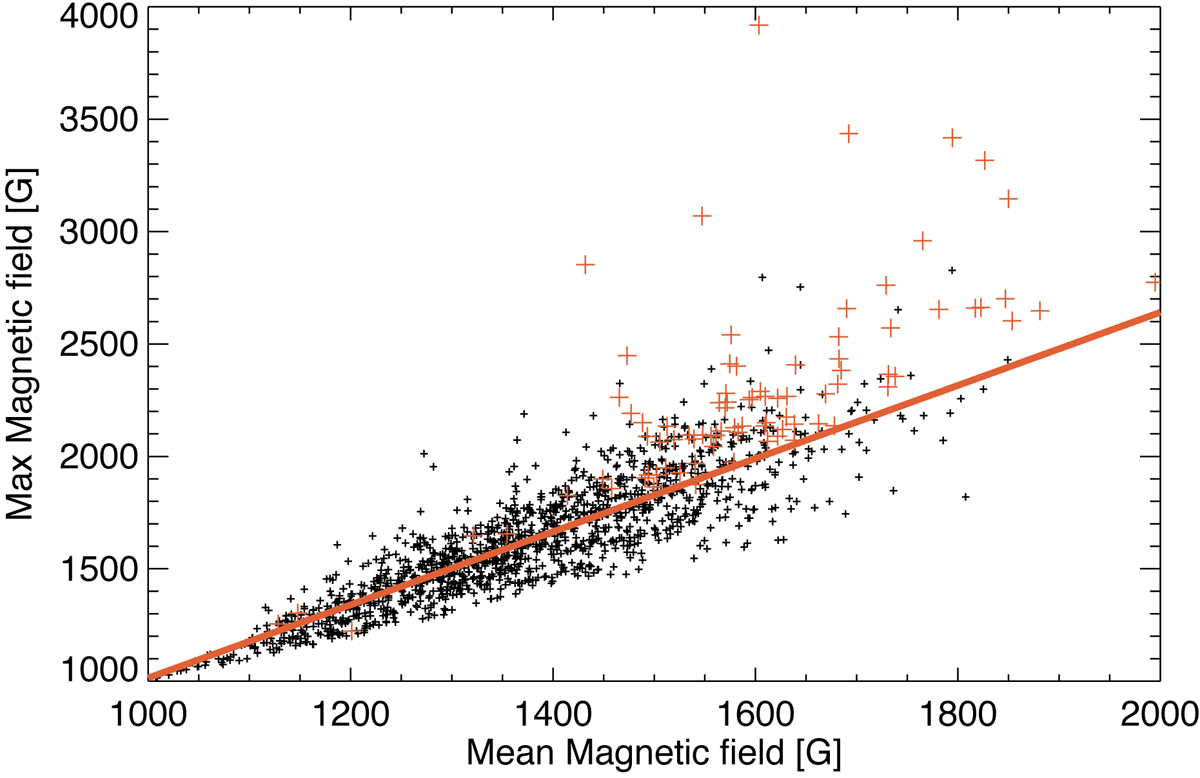
Correlation between mean and maximum magnetic field strength of kG features in plage areas at log(τ) = − 0.8. The black dots belong to patches without pores and the solid red line represents a linear fit. The red crosses represent patches that contain pore pixels.
Current usage metrics show cumulative count of Article Views (full-text article views including HTML views, PDF and ePub downloads, according to the available data) and Abstracts Views on Vision4Press platform.
Data correspond to usage on the plateform after 2015. The current usage metrics is available 48-96 hours after online publication and is updated daily on week days.
Initial download of the metrics may take a while.