Free Access
Fig. 1.
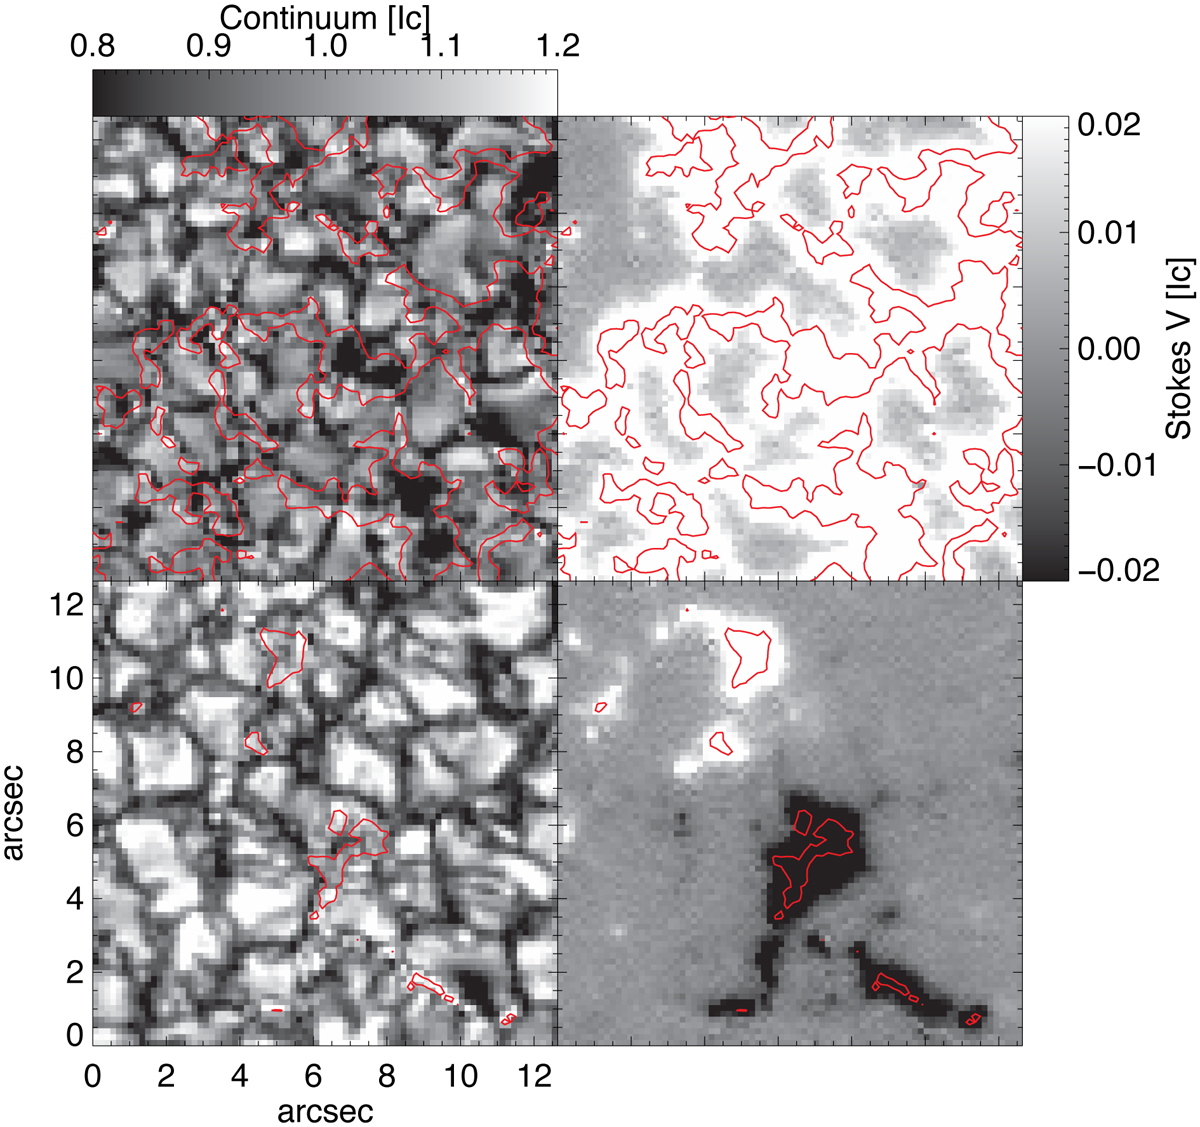
Continuum intensity and Stokes V images of a plage region, top row, and a network region, bottom row. The red contour lines encompass kG magnetic fields at log(τ) = − 0.8. The Stokes V images display the signal amplitude at 6301−0.06 Å and have been saturated at a level of 2%.
Current usage metrics show cumulative count of Article Views (full-text article views including HTML views, PDF and ePub downloads, according to the available data) and Abstracts Views on Vision4Press platform.
Data correspond to usage on the plateform after 2015. The current usage metrics is available 48-96 hours after online publication and is updated daily on week days.
Initial download of the metrics may take a while.