Fig. 8.
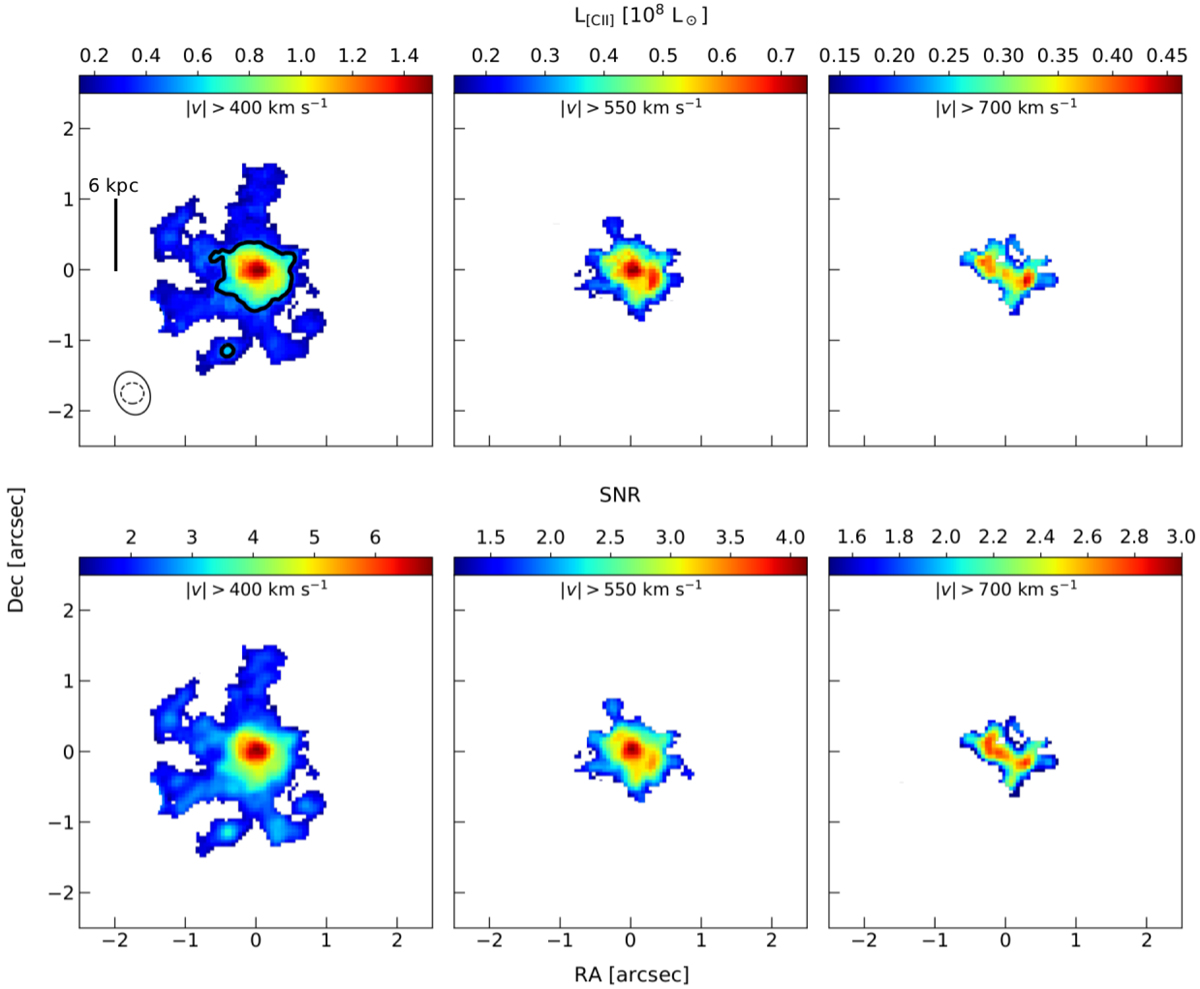
Top: luminosity maps of the high-velocity [CII] emission derived from the whole sample stacked cube. From left to right panels: emission at increasing absolute velocities, specifically |v| > 400 km s−1, |v| > 550 km s−1 and |v| > 700 km s−1. Maps were obtained by summing the emission at > 3σ in 80 km s−1 channel maps for at least three channels (i.e. ≳250 km s−1). The variance-weighted beam of the stacked cube is also indicated in the first map (solid line), together with the smallest beam contributing to the stack (dashed line). The thick solid contour encloses the region from which 50% of ![]() arises. Bottom: signal-to-noise maps associated with the different velocity bins.
arises. Bottom: signal-to-noise maps associated with the different velocity bins.
Current usage metrics show cumulative count of Article Views (full-text article views including HTML views, PDF and ePub downloads, according to the available data) and Abstracts Views on Vision4Press platform.
Data correspond to usage on the plateform after 2015. The current usage metrics is available 48-96 hours after online publication and is updated daily on week days.
Initial download of the metrics may take a while.