Fig. 7.
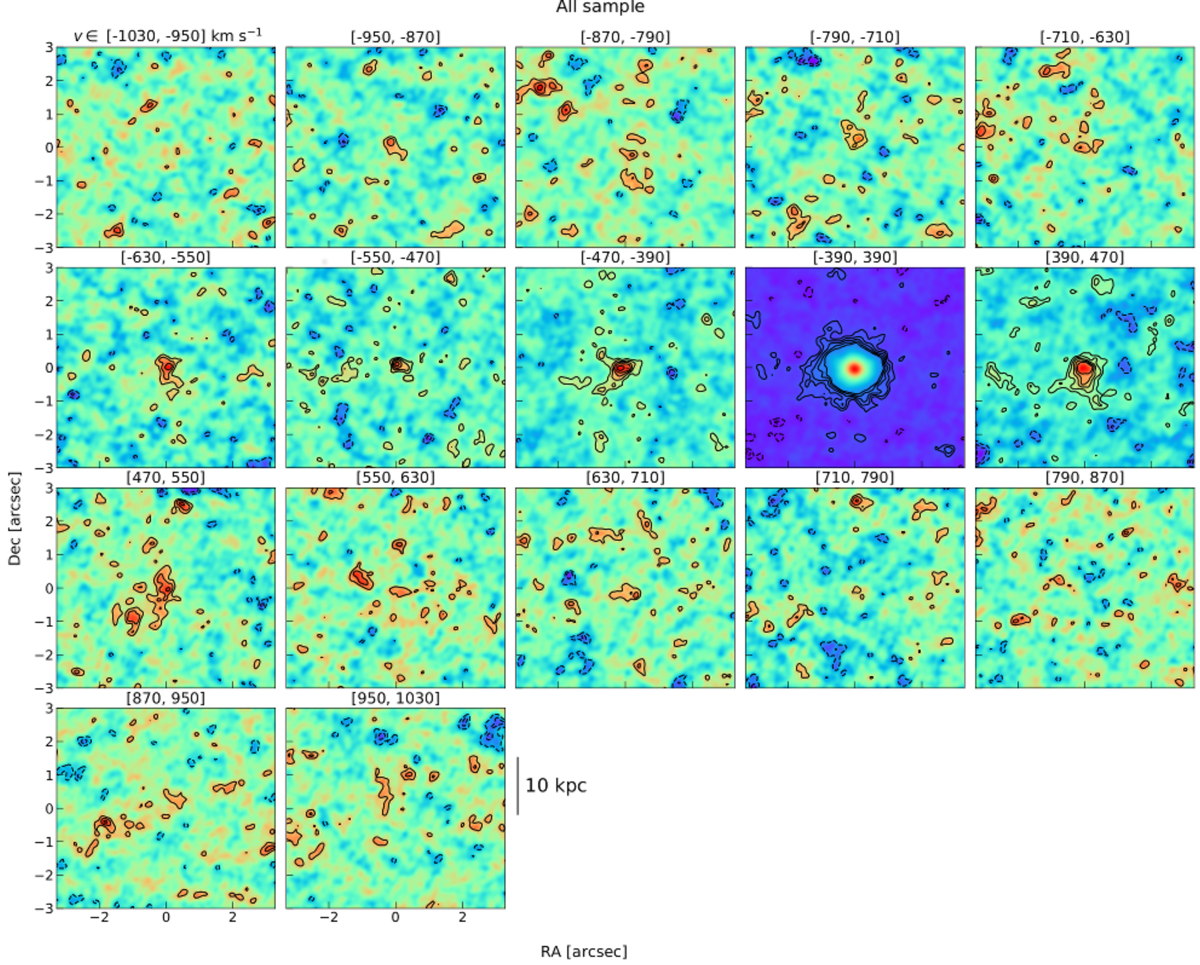
Channel maps of the whole sample stacked cube, corresponding to the central 6″ × 6″ in the velocity range v∈ [−1000, 1000] km s−1 (in bins of 80 km s−1, as indicated by the top labels). The bulk of the [CII] core emission is collapsed in the channel v∈[−390, 390] km s−1. Contours correspond to [−3, −2, 2, 3, 4, 5, 6]σ, where σ is the rms sensitivity evaluated for each channel.
Current usage metrics show cumulative count of Article Views (full-text article views including HTML views, PDF and ePub downloads, according to the available data) and Abstracts Views on Vision4Press platform.
Data correspond to usage on the plateform after 2015. The current usage metrics is available 48-96 hours after online publication and is updated daily on week days.
Initial download of the metrics may take a while.