Fig. 3.
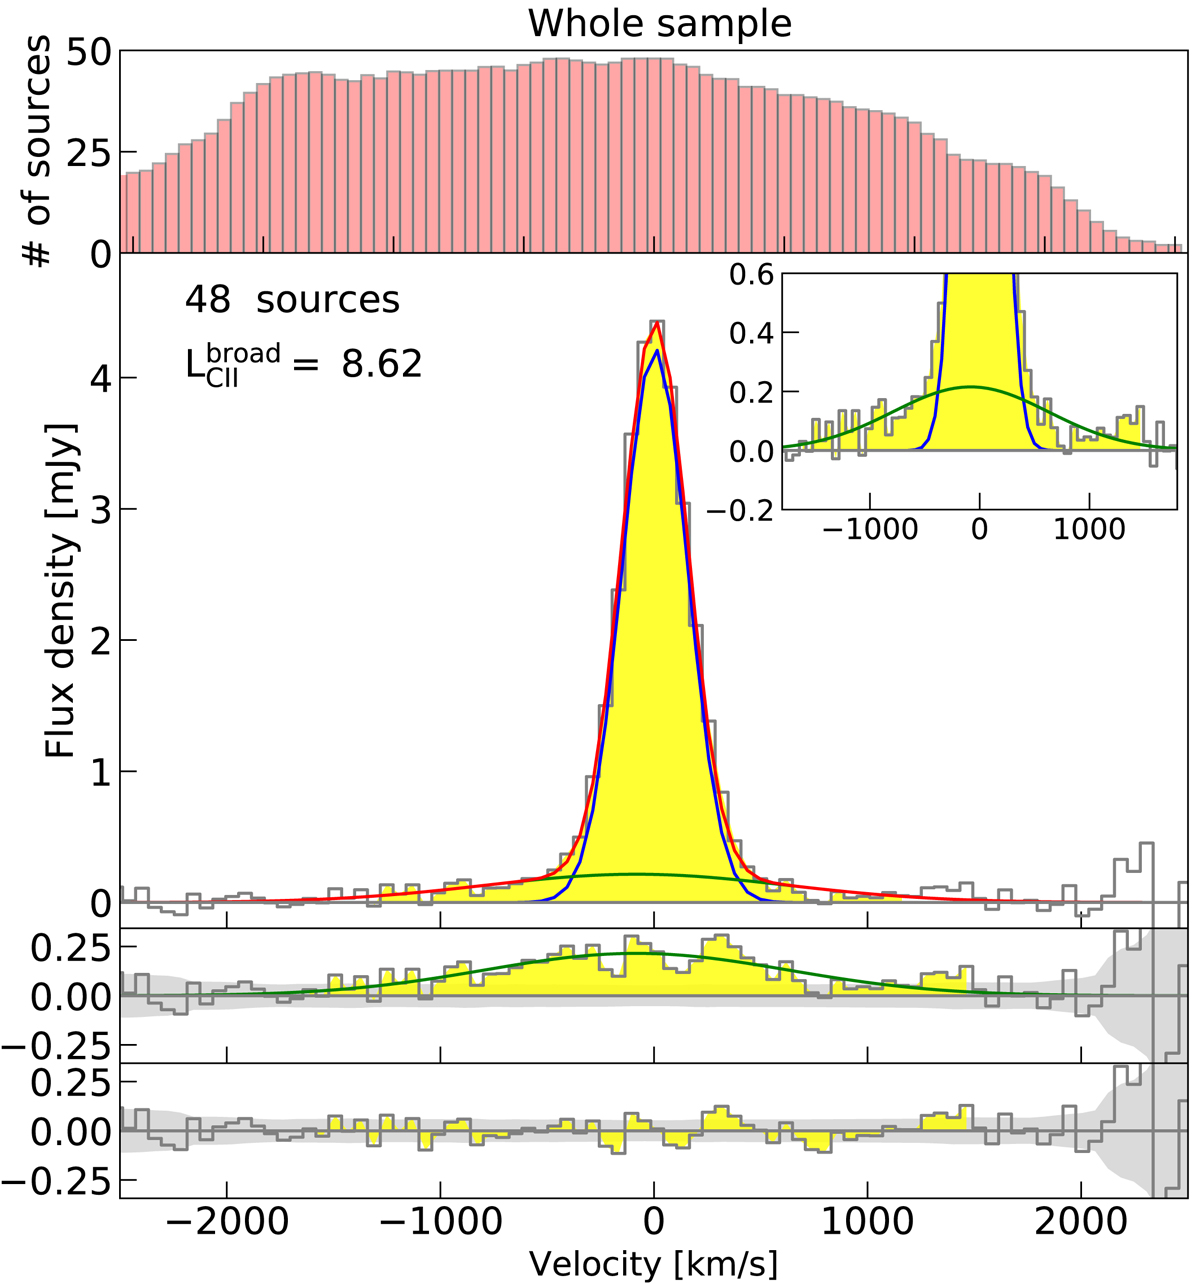
Whole sample stacked integrated spectrum. First panel from top: number of sources contributing to the stack at different velocities. Second panel from top: [CII] flux density as a function of velocity, in spectral bins of 60 km s−1. The red curve represents the best-fit 2 Gaussian components model: the combination of a core component (blue) and a broad component (green) is needed to properly reproduce the data. Labels indicate the number of stacked sources and the luminosity of the broad [CII] wings. The inset shows a zoom on the broad component. Third panel from top: residuals from the subtraction of the core component (blue line in the second panel). The green curve shows the best fit broad component. Fourth panel: residuals from the two Gaussian components fitting. The 1σ rms of the spectrum is also indicated by the shaded region.
Current usage metrics show cumulative count of Article Views (full-text article views including HTML views, PDF and ePub downloads, according to the available data) and Abstracts Views on Vision4Press platform.
Data correspond to usage on the plateform after 2015. The current usage metrics is available 48-96 hours after online publication and is updated daily on week days.
Initial download of the metrics may take a while.