Fig. 11.
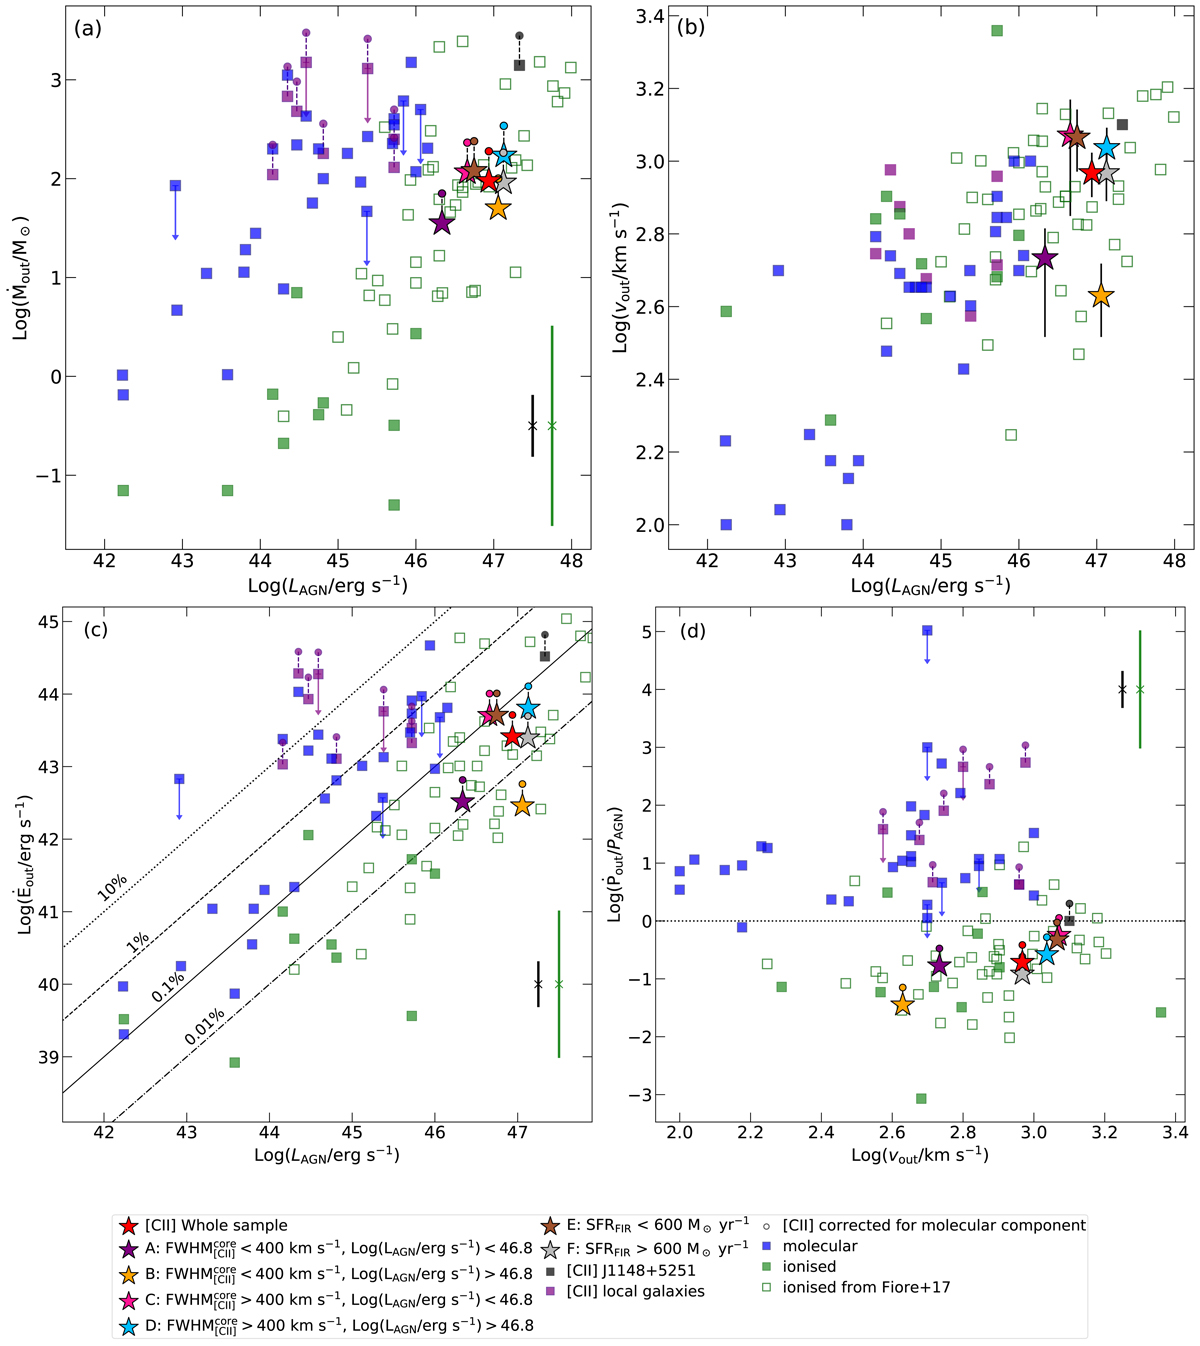
[CII] outflows parameters. (a): Mass outflow rate as a function of LAGN for the different stacked spectra (stars, see legend for details), compared to the sample of 30 low-redshift AGN from Fluetsch et al. (2019) for which spatially resolved molecular (blue) and, in one third of the sample, ionised (green) outflows have been observed. We also included the compilation of ionised outflows (hollow green squares) with spatial information in z ∼ 0.1−3 AGN from Fiore et al. (2017), recomputed according to Eqs. (4)–(6). Purple squares are local systems for which the outflow has been traced in [CII] through observations with the Herschel Space Observatory (Janssen et al. 2016; Fluetsch et al. 2019). By applying the atomic-to-molecular outflowing gas mass correction by Fluetsch et al. (2019), the molecular+atomic mass outflow rates are shown with circles. The typical ∼0.3 dex uncertainty on Ṁout for the [CII] outflows found in our z ∼ 6 QSOs (similar to that of outflows in the atomic neutral and molecular phase in low-z AGN) is shown by the black solid line, while the uncertainty on Ṁout for the ionised outflows is shown by the green line. (b): Outflow velocity as a function of LAGN. (c): Kinetic power as a function of LAGN. The dotted, dashed, solid and dot-dashed curves indicate kinetic powers that are 10%, 1%, 0.1% and 0.01% of the AGN luminosity. (d): Momentum load factor as a function of the outflow velocity. The horizontal line corresponds to Ṗout = PAGN.
Current usage metrics show cumulative count of Article Views (full-text article views including HTML views, PDF and ePub downloads, according to the available data) and Abstracts Views on Vision4Press platform.
Data correspond to usage on the plateform after 2015. The current usage metrics is available 48-96 hours after online publication and is updated daily on week days.
Initial download of the metrics may take a while.