Fig. 3
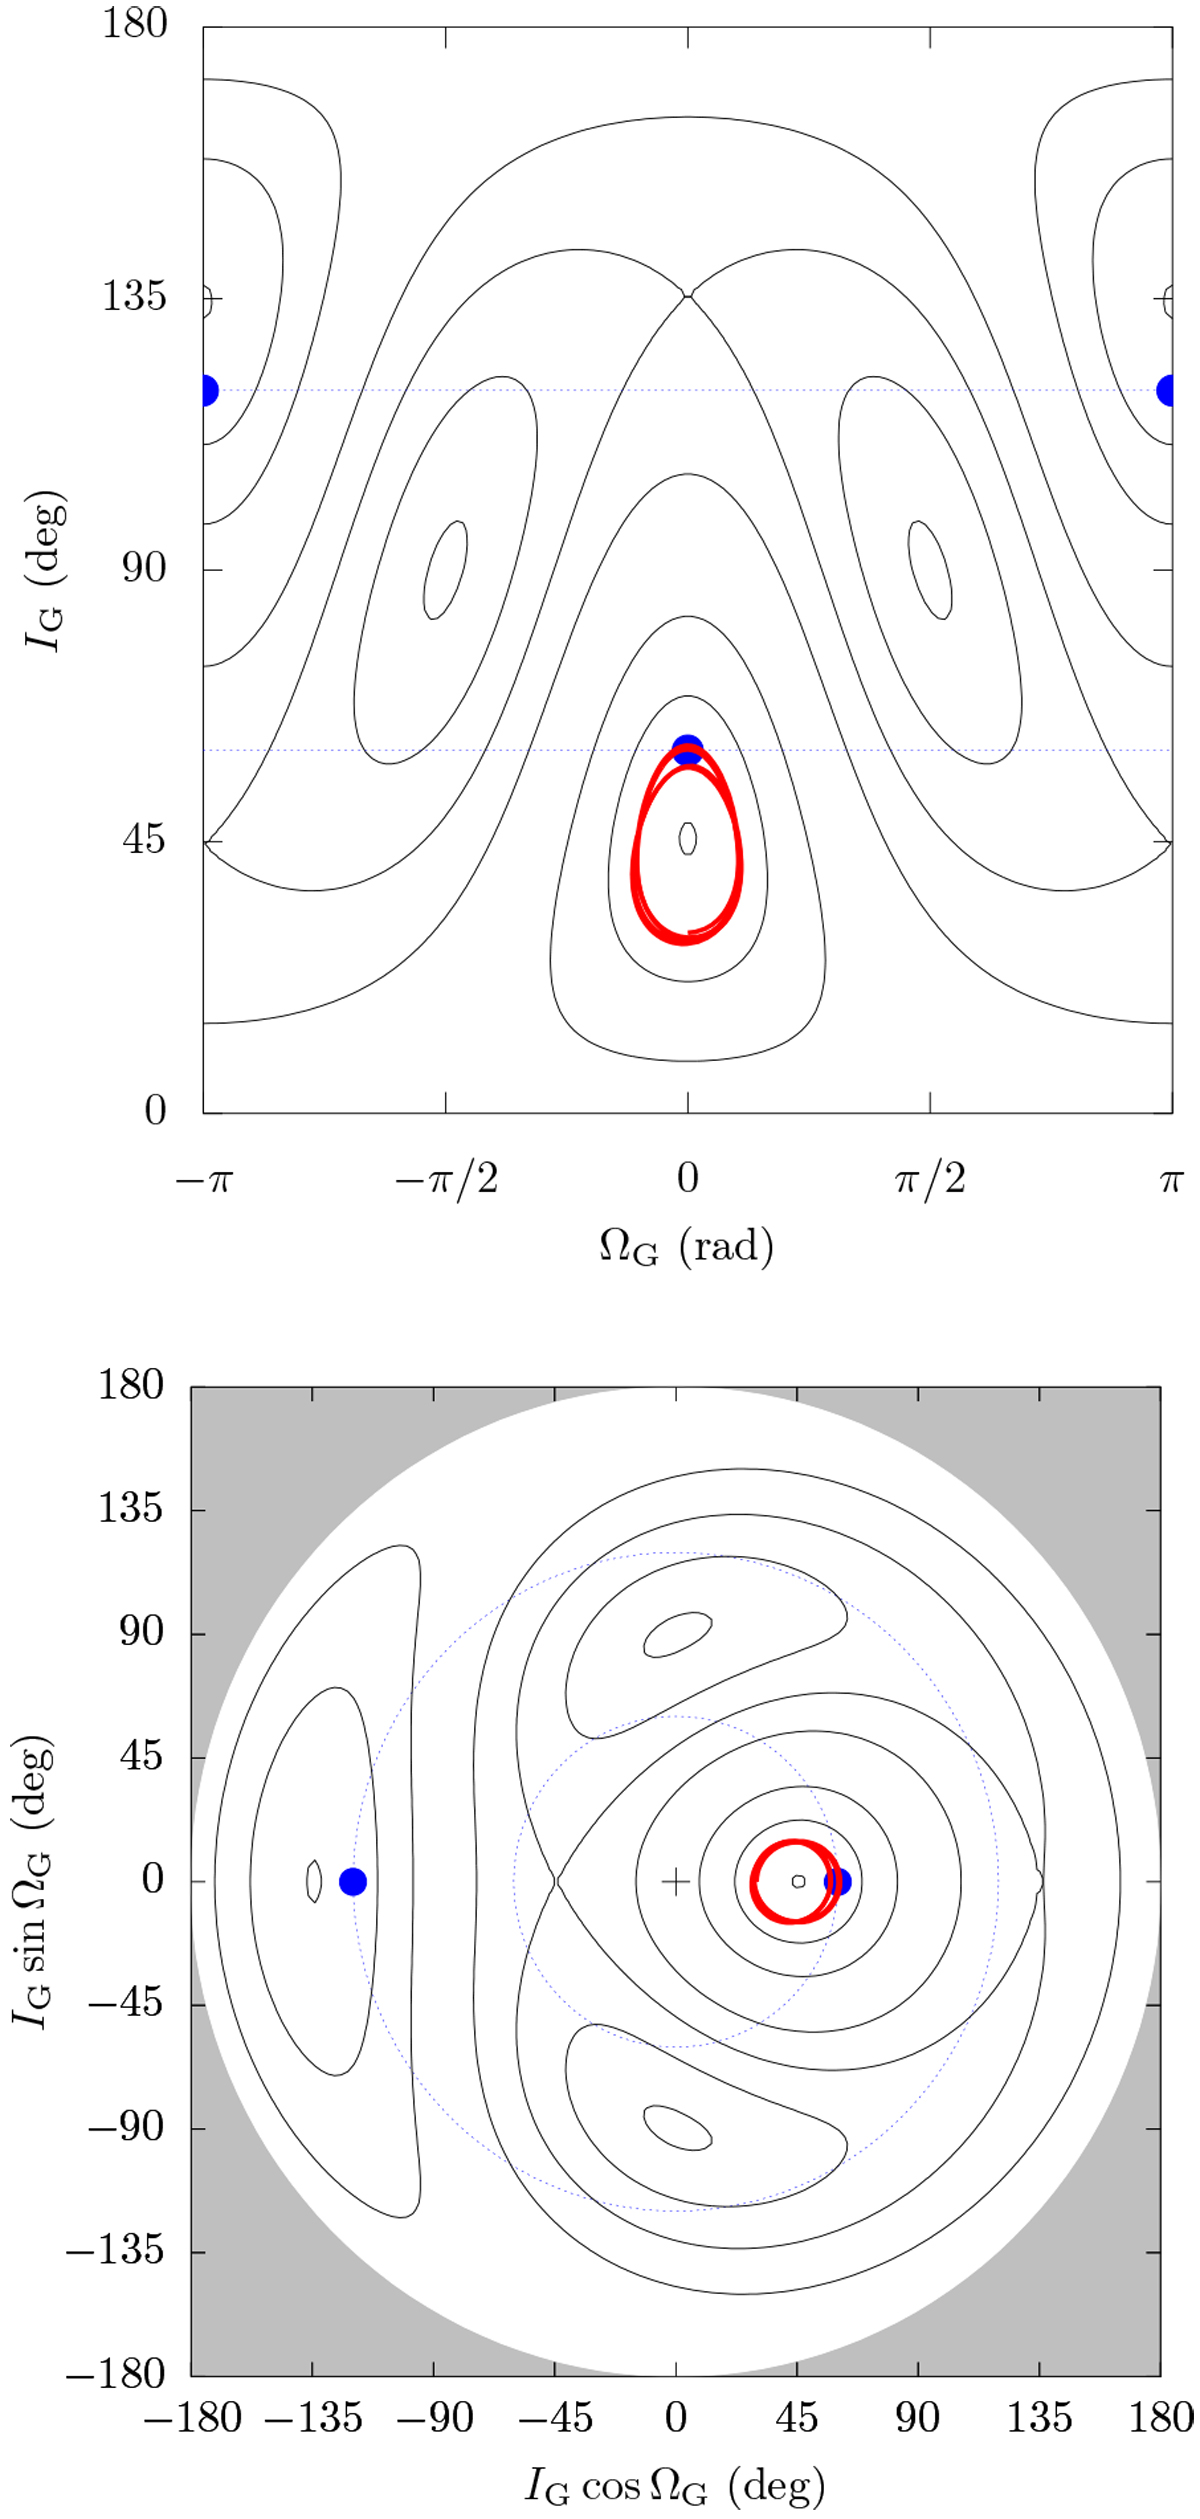
Level curves of the Hamiltonian function ![]() (Eq. (13)) for a circular orbit. The semi-major axis taken as parameter is
a = 900 au, and the level curves are shown in black. The two graphs show the same level curves for two sets of variables (in order to avoid being misled by coordinate singularities). The dotted curves represent the inclination
ψ
of the ecliptic, and the blue spots show the location of the ecliptic plane. The red curve shows an example of nearly circular trajectory precessing around the normal to its local Laplace plane, obtained by numerical integration. The eccentricity slightly varies creating a deviation from the initial level curve. The oscillation period around the fixed centre is about 200 Gyrs, in accordance with Fig 5.
(Eq. (13)) for a circular orbit. The semi-major axis taken as parameter is
a = 900 au, and the level curves are shown in black. The two graphs show the same level curves for two sets of variables (in order to avoid being misled by coordinate singularities). The dotted curves represent the inclination
ψ
of the ecliptic, and the blue spots show the location of the ecliptic plane. The red curve shows an example of nearly circular trajectory precessing around the normal to its local Laplace plane, obtained by numerical integration. The eccentricity slightly varies creating a deviation from the initial level curve. The oscillation period around the fixed centre is about 200 Gyrs, in accordance with Fig 5.
Current usage metrics show cumulative count of Article Views (full-text article views including HTML views, PDF and ePub downloads, according to the available data) and Abstracts Views on Vision4Press platform.
Data correspond to usage on the plateform after 2015. The current usage metrics is available 48-96 hours after online publication and is updated daily on week days.
Initial download of the metrics may take a while.