Fig. 22
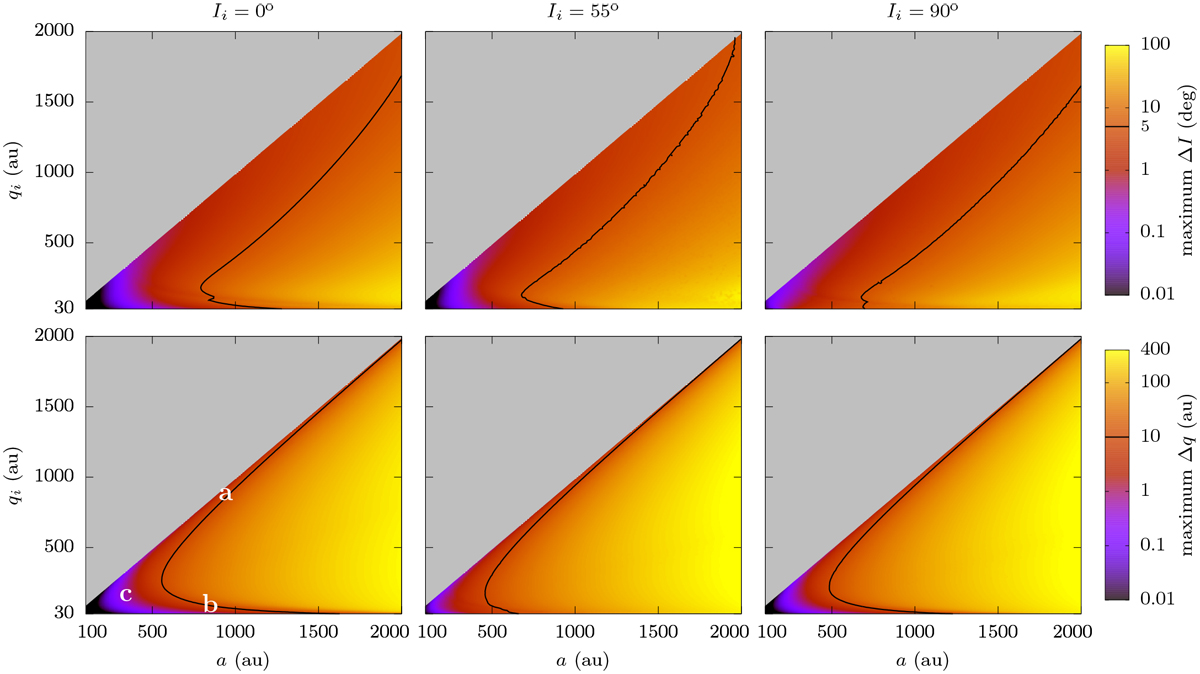
Limits of the inert region in the (a, q) plane. Each column corresponds to a different value of the initial ecliptic inclination (see titles). The colour scale represents the maximum possible orbital variations in 4.5 Gyrs: the top row shows the variation of ecliptic inclination, and the bottom row shows the variations of perihelion distance (see labels on the right). The black level corresponds to a variation of 5o in inclination (top row) or 10 au in perihelion distance (bottom row). Below the black level, the region can be considered inert. See text for the white symbols.
Current usage metrics show cumulative count of Article Views (full-text article views including HTML views, PDF and ePub downloads, according to the available data) and Abstracts Views on Vision4Press platform.
Data correspond to usage on the plateform after 2015. The current usage metrics is available 48-96 hours after online publication and is updated daily on week days.
Initial download of the metrics may take a while.