Fig. 19
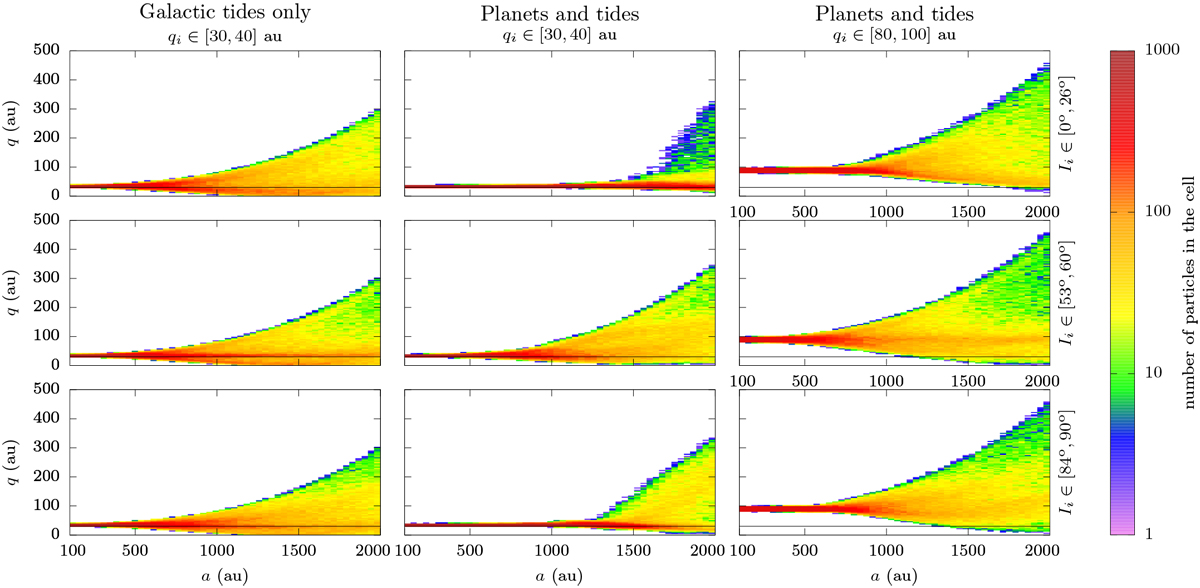
Distribution of a few samples of particles after 4.5 Gyrs in the plane (a, q). As indicated in the titles, the first column is for an evolution with only the galactic tides (Hamiltonian
![]() , Eq. (12)), and the second and third columns are for an evolution with both planets and galactic tides (Hamiltonian
, Eq. (12)), and the second and third columns are for an evolution with both planets and galactic tides (Hamiltonian ![]() , Eq. (13)). Six slices of initial conditions are shown, as written in the top and right side of the graphs: the first two columns are for initial perihelion distance qi in [30, 40] au, and the thirdone in [80, 100] au, while the cosine of the initial ecliptic inclination Ii is distributed in [0.9, 1] for the top row, [0.5, 0.6] for the middle row, and [0, 0.1] for the bottom row. On each graph, the horizontal black line shows the semi-major axis of Neptune (~ 30 au) for reference.
, Eq. (13)). Six slices of initial conditions are shown, as written in the top and right side of the graphs: the first two columns are for initial perihelion distance qi in [30, 40] au, and the thirdone in [80, 100] au, while the cosine of the initial ecliptic inclination Ii is distributed in [0.9, 1] for the top row, [0.5, 0.6] for the middle row, and [0, 0.1] for the bottom row. On each graph, the horizontal black line shows the semi-major axis of Neptune (~ 30 au) for reference.
Current usage metrics show cumulative count of Article Views (full-text article views including HTML views, PDF and ePub downloads, according to the available data) and Abstracts Views on Vision4Press platform.
Data correspond to usage on the plateform after 2015. The current usage metrics is available 48-96 hours after online publication and is updated daily on week days.
Initial download of the metrics may take a while.