Open Access
Fig. 18
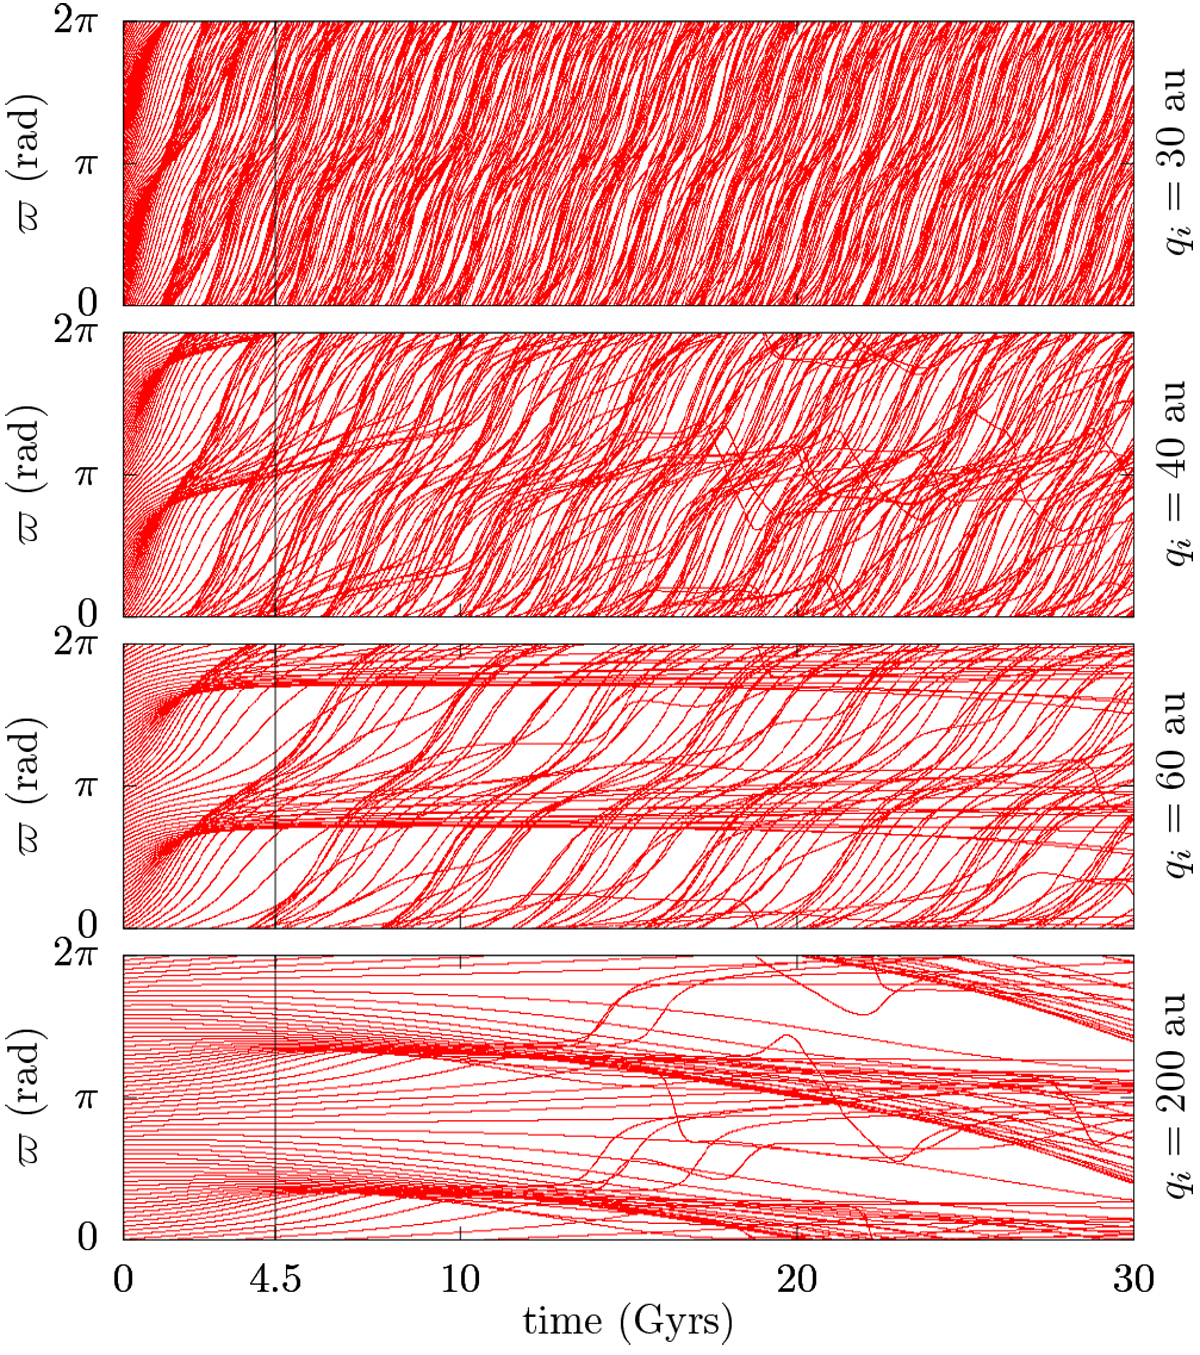
Temporal evolution of orbits with a = 1800 au. The initial conditions are I = 0o, and ϖ = ω + Ω equally distributed in [0, 2π]; the initial value qi of the perihelion distance is written on the right of each graph. The vertical black line marks the 4.5 Gyrs time, at which our density maps (e.g. Fig. 17) are computed.
Current usage metrics show cumulative count of Article Views (full-text article views including HTML views, PDF and ePub downloads, according to the available data) and Abstracts Views on Vision4Press platform.
Data correspond to usage on the plateform after 2015. The current usage metrics is available 48-96 hours after online publication and is updated daily on week days.
Initial download of the metrics may take a while.