Free Access
Fig. 5
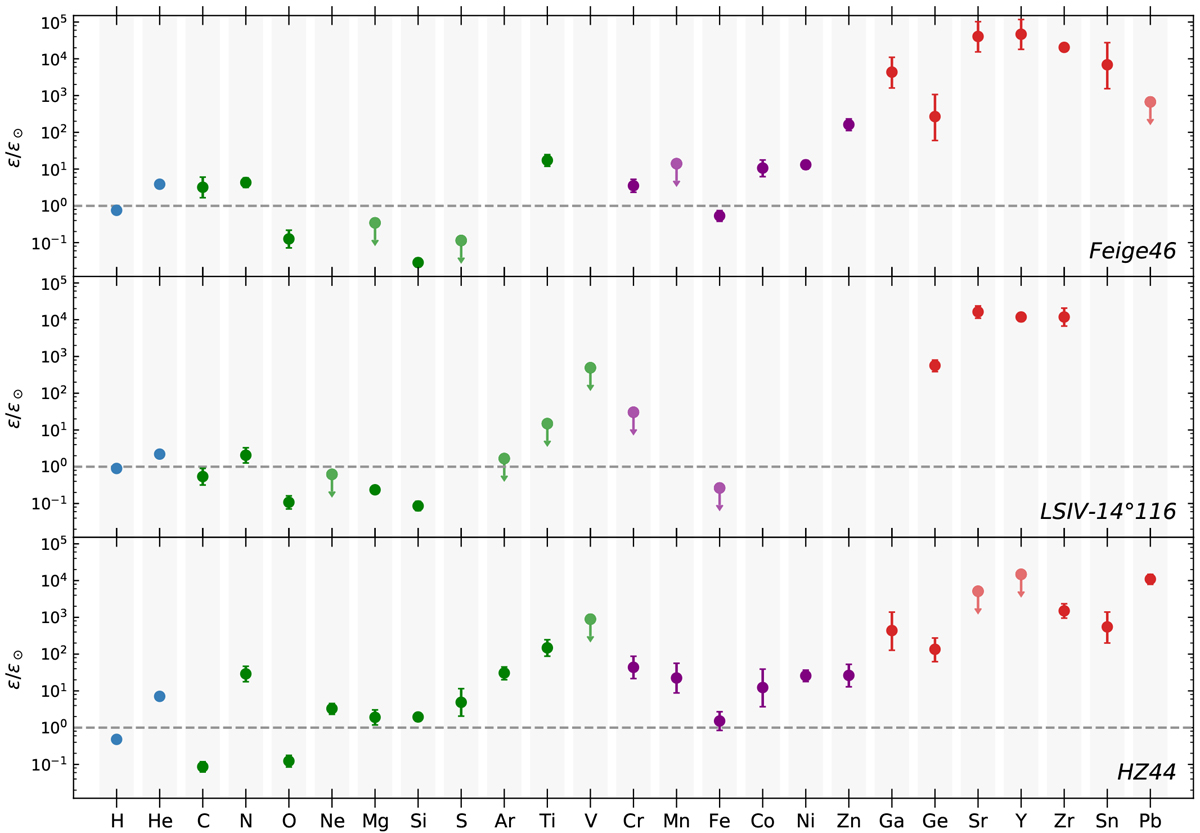
Comparison between the abundance pattern of Feige 46, LSIV– 14°116 (Naslim et al. 2011) and HZ 44 (Dorsch et al. 2019). Light elements (23 ≤ Z) are marked by green symbols, iron-peak elements (24 ≤ Z ≤ 30) are plotted in purple, and heavier elements (Z ≥ 31) in red.
Current usage metrics show cumulative count of Article Views (full-text article views including HTML views, PDF and ePub downloads, according to the available data) and Abstracts Views on Vision4Press platform.
Data correspond to usage on the plateform after 2015. The current usage metrics is available 48-96 hours after online publication and is updated daily on week days.
Initial download of the metrics may take a while.