Fig. 3
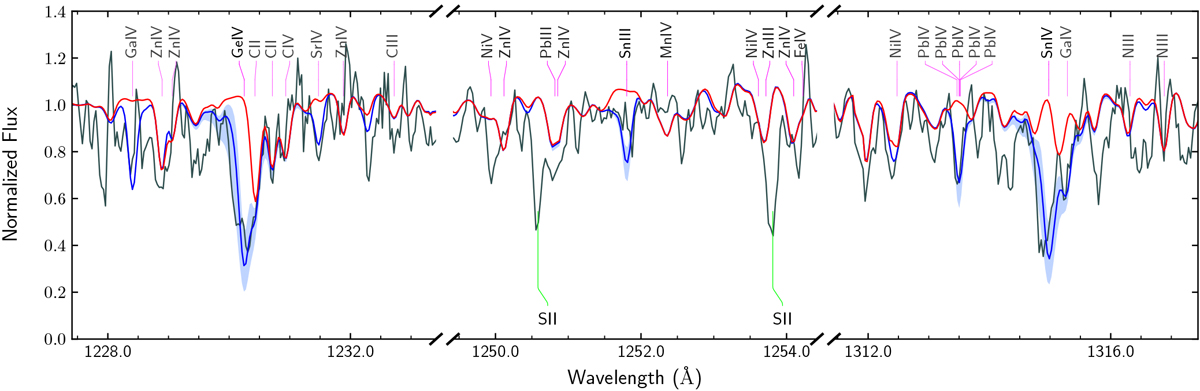
Comparison between the IUE and synthetic spectra in the ranges where Ge, Sn, and Pb lines are seen. The modelspectra shown in blue include the estimated abundances of Ge and Sn (from Table 1); the uncertainty range is indicated by a shaded area. The lower bound of the shaded area for the Pb line represents the upper limit for Pb listed in Table 1 plus its uncertainty (i.e., log Pb/H = −6.7). A synthetic spectrum computed without the contribution of Ge, Sn, and Pb is shown as comparison in red. All spectra are smoothed with a three-pixel box filter for clarity.
Current usage metrics show cumulative count of Article Views (full-text article views including HTML views, PDF and ePub downloads, according to the available data) and Abstracts Views on Vision4Press platform.
Data correspond to usage on the plateform after 2015. The current usage metrics is available 48-96 hours after online publication and is updated daily on week days.
Initial download of the metrics may take a while.