Fig. 3.
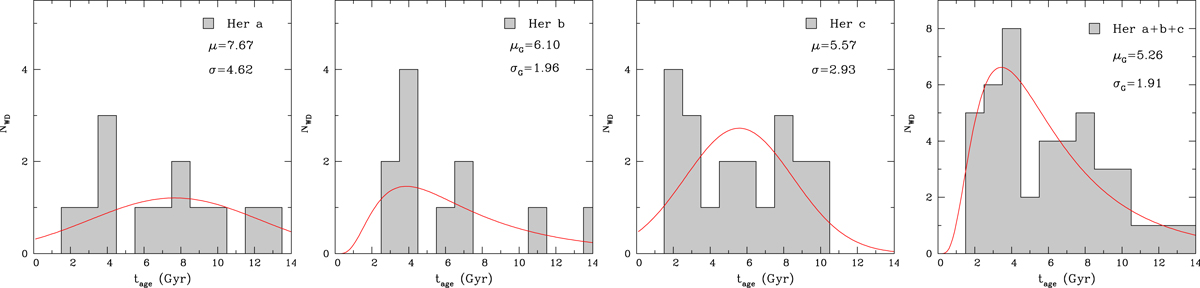
Age distribution for each of the three Hercules substreams identified in this work and for all of them considered together (right panel). The substream Her b presents a maximum at around 4 Gyr with an extended long tail up to very old ages. Her a is similar, but with a less clear peak. Substream Her c appears as a more uniform distribution between 2 and 10 Gyr. We also plot as red lines analytical normal fits for Her a and c and a log-normal fit for Her c and the entire distribution. The corresponding mean μ and deviation σ, the geometric mean μG, and the multiplicative deviation σG are depicted in each panel.
Current usage metrics show cumulative count of Article Views (full-text article views including HTML views, PDF and ePub downloads, according to the available data) and Abstracts Views on Vision4Press platform.
Data correspond to usage on the plateform after 2015. The current usage metrics is available 48-96 hours after online publication and is updated daily on week days.
Initial download of the metrics may take a while.