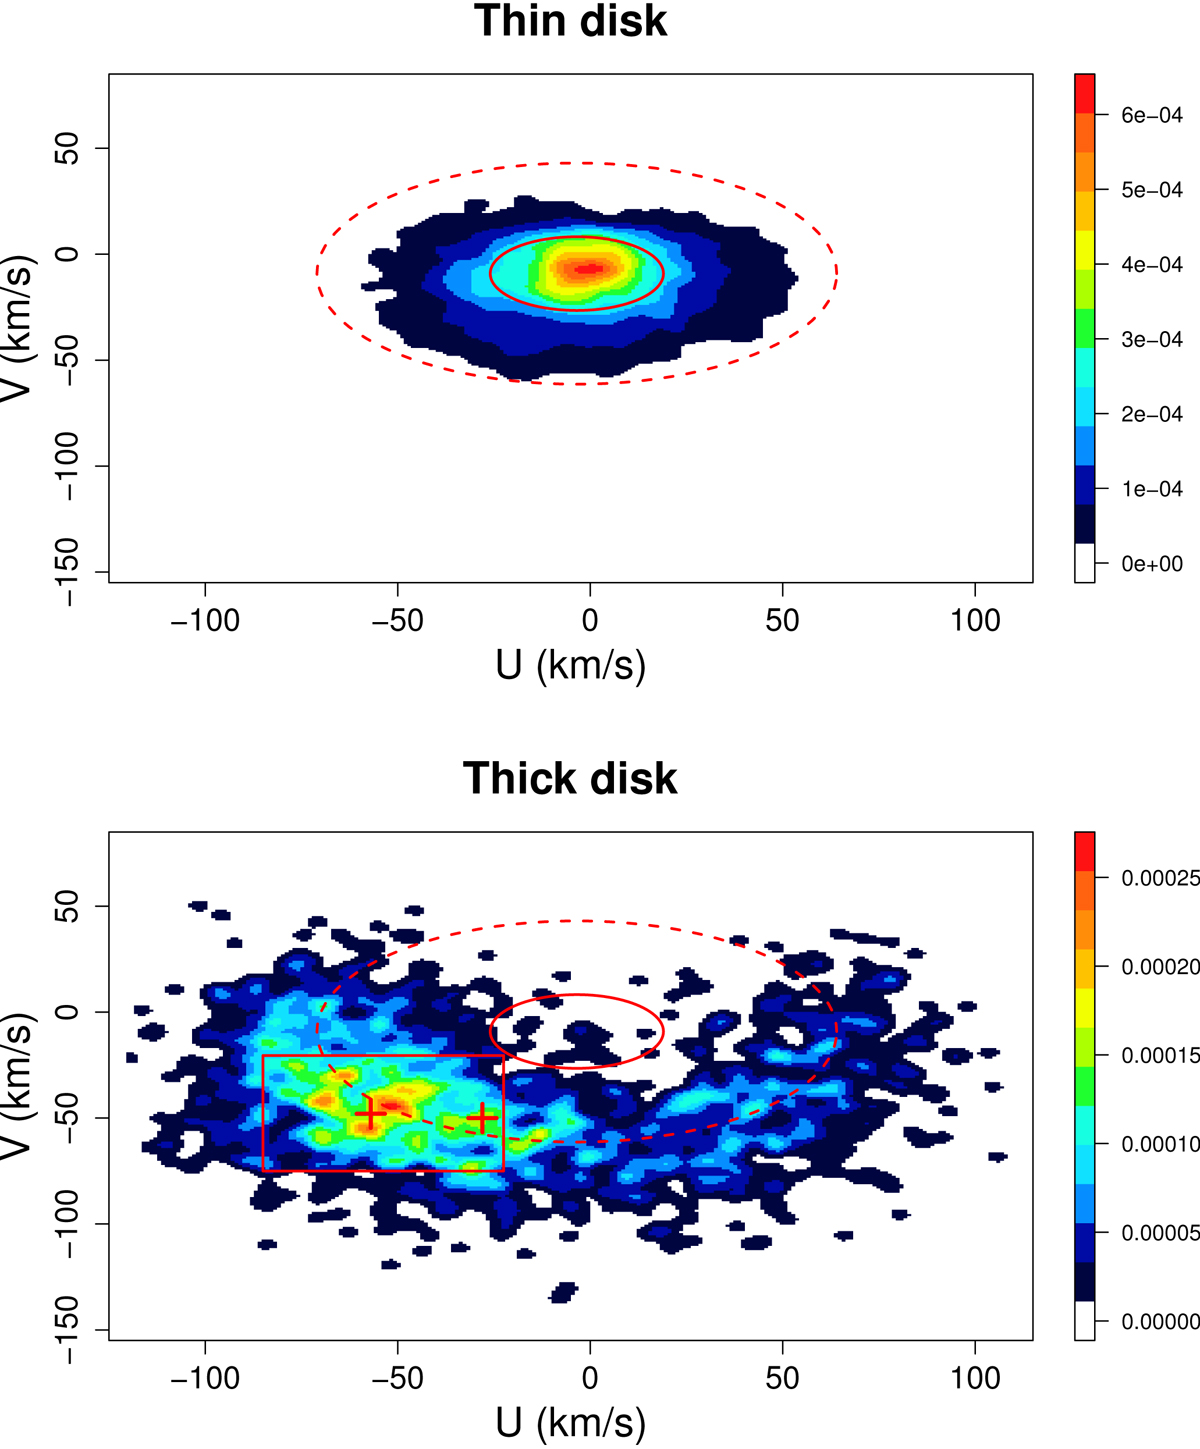
Fig. 1.

UV density diagram for the thin- (top panel) and thick-disk (bottom panel) white dwarf population within 100 pc from the Sun. A clear overdensity is revealed in the thick-disk population (delimited by a red rectangle). For comparative purposes, we show the thin-disk dispersion ellipsoid for 1σ (continuous line) and 3σ (dashed line) levels corresponding to the thin-disk population (Torres et al. 2019), and we illustrate the number density (right scales) of white dwarf stars per 1 × 1 (km s)−2. The location of the Hercules substreams from Antoja et al. (2012) is shown with red crosses. See text for details.
Current usage metrics show cumulative count of Article Views (full-text article views including HTML views, PDF and ePub downloads, according to the available data) and Abstracts Views on Vision4Press platform.
Data correspond to usage on the plateform after 2015. The current usage metrics is available 48-96 hours after online publication and is updated daily on week days.
Initial download of the metrics may take a while.


