Fig. 9
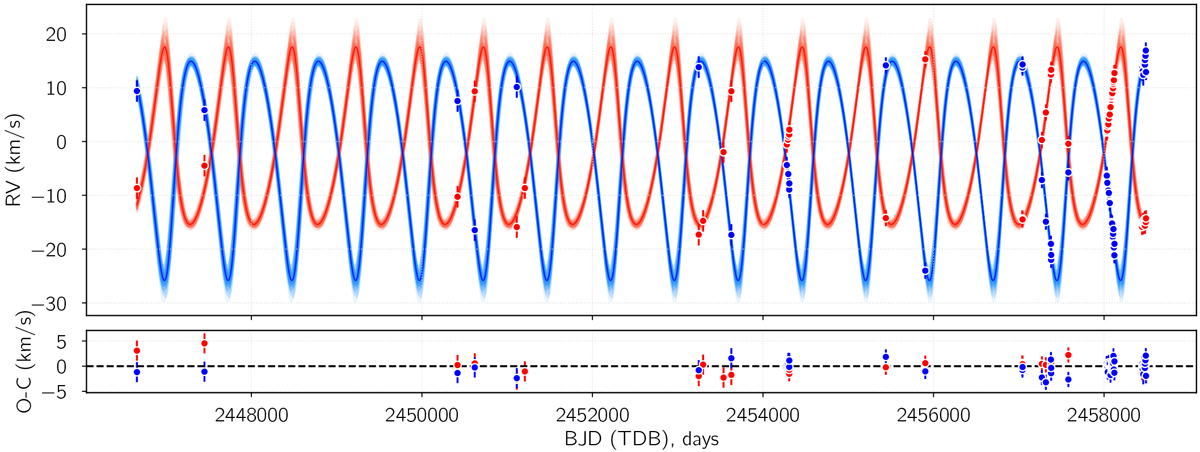
Radial velocity measurements of the two stars along the ~32 yr of observations. Red and blue symbols and lines correspond to components D and S from the Gaussian fittings of the narrow Ca II K absorptions, which in turn correspond to stars A and B, respectively. Upper panel: model corresponding to the median values of the posterior distributions of the parameters as thick lines and 100 random samples drawn from the final MCMC chain; lower panel: residuals.
Current usage metrics show cumulative count of Article Views (full-text article views including HTML views, PDF and ePub downloads, according to the available data) and Abstracts Views on Vision4Press platform.
Data correspond to usage on the plateform after 2015. The current usage metrics is available 48-96 hours after online publication and is updated daily on week days.
Initial download of the metrics may take a while.