Free Access
Fig. 8
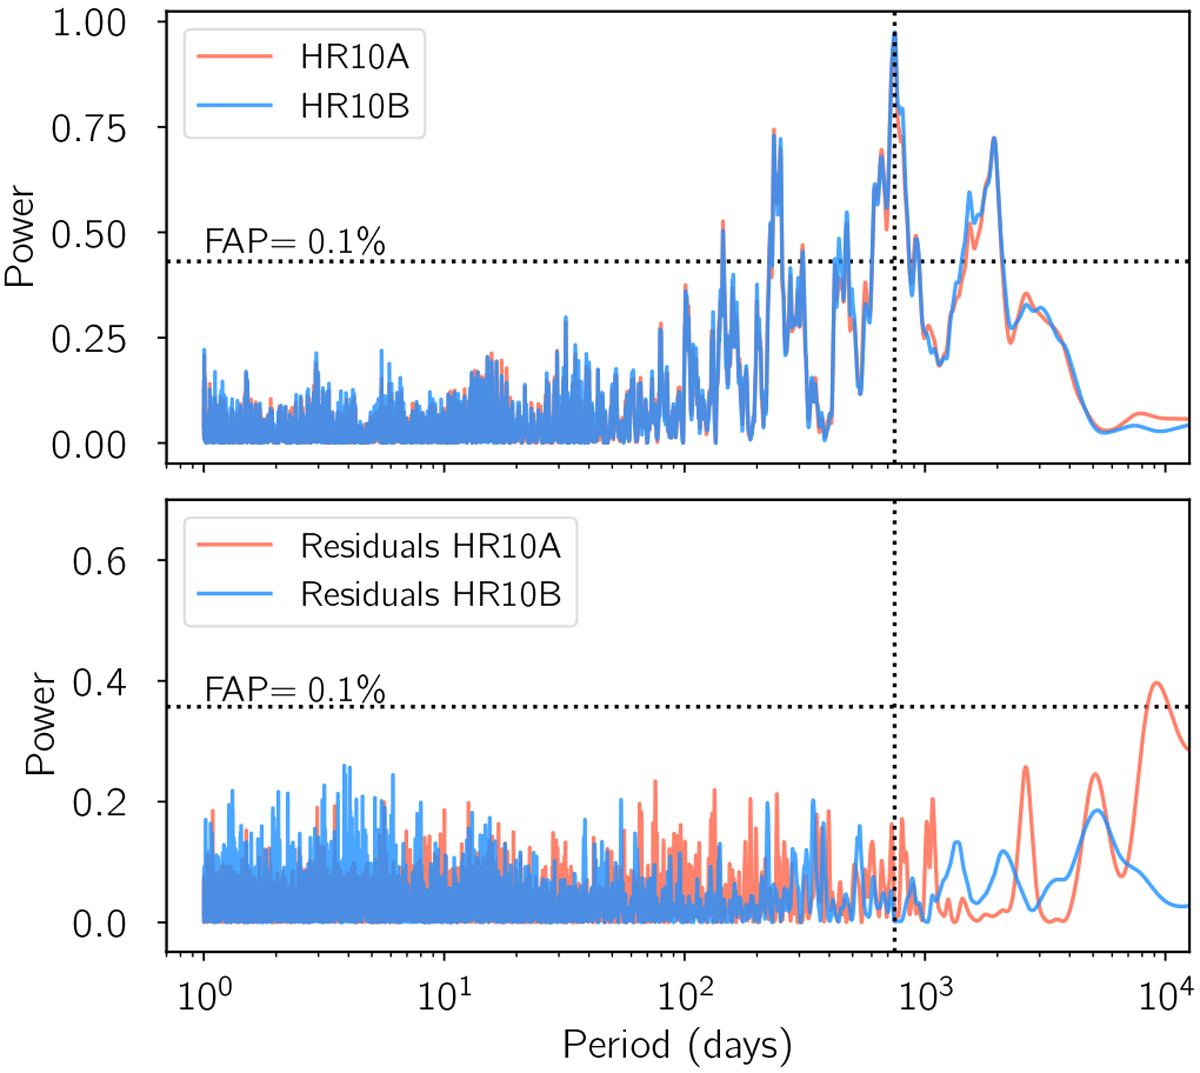
Top: periodogram corresponding to the RV measurements for each of the two components of the binary system in HR 10. The 0.1% FAP is shown as a horizontal dotted line and the final orbital period is displayed as a vertical dotted line. Bottom: periodogram of the residuals of the RV modelling.
Current usage metrics show cumulative count of Article Views (full-text article views including HTML views, PDF and ePub downloads, according to the available data) and Abstracts Views on Vision4Press platform.
Data correspond to usage on the plateform after 2015. The current usage metrics is available 48-96 hours after online publication and is updated daily on week days.
Initial download of the metrics may take a while.