Fig. 7
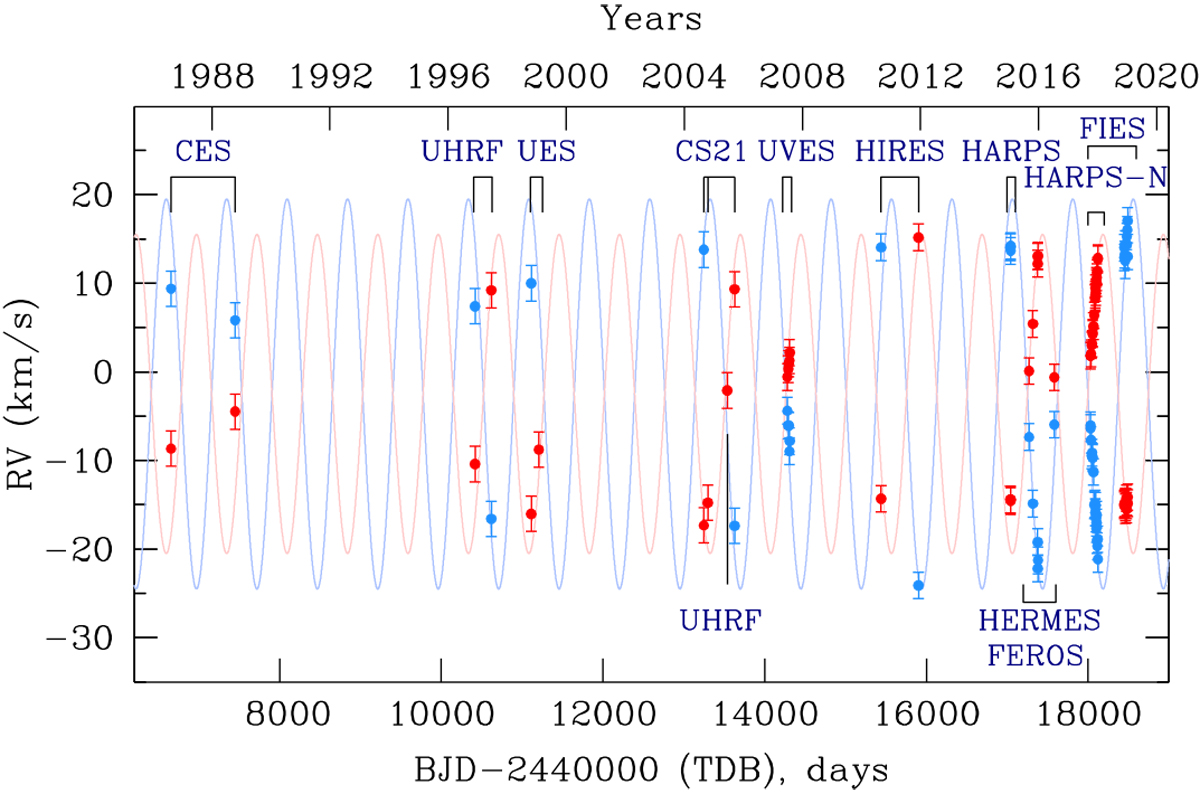
Radial velocities of the components D (red) and S (blue) of the CS Ca II K narrow absorption features for all the observations. The sinusoidal curves plotted as pale red and blue have the only purpose toshow, in a qualitative way, that the behaviour of the RVs shows a periodic pattern during the ~ 32-yr interval covered by the observations. The exact treatment of the data is explained in Sect. 6.2. The labels indicate the instruments with which the observations were obtained (see Sect. 4).
Current usage metrics show cumulative count of Article Views (full-text article views including HTML views, PDF and ePub downloads, according to the available data) and Abstracts Views on Vision4Press platform.
Data correspond to usage on the plateform after 2015. The current usage metrics is available 48-96 hours after online publication and is updated daily on week days.
Initial download of the metrics may take a while.