Fig. 6
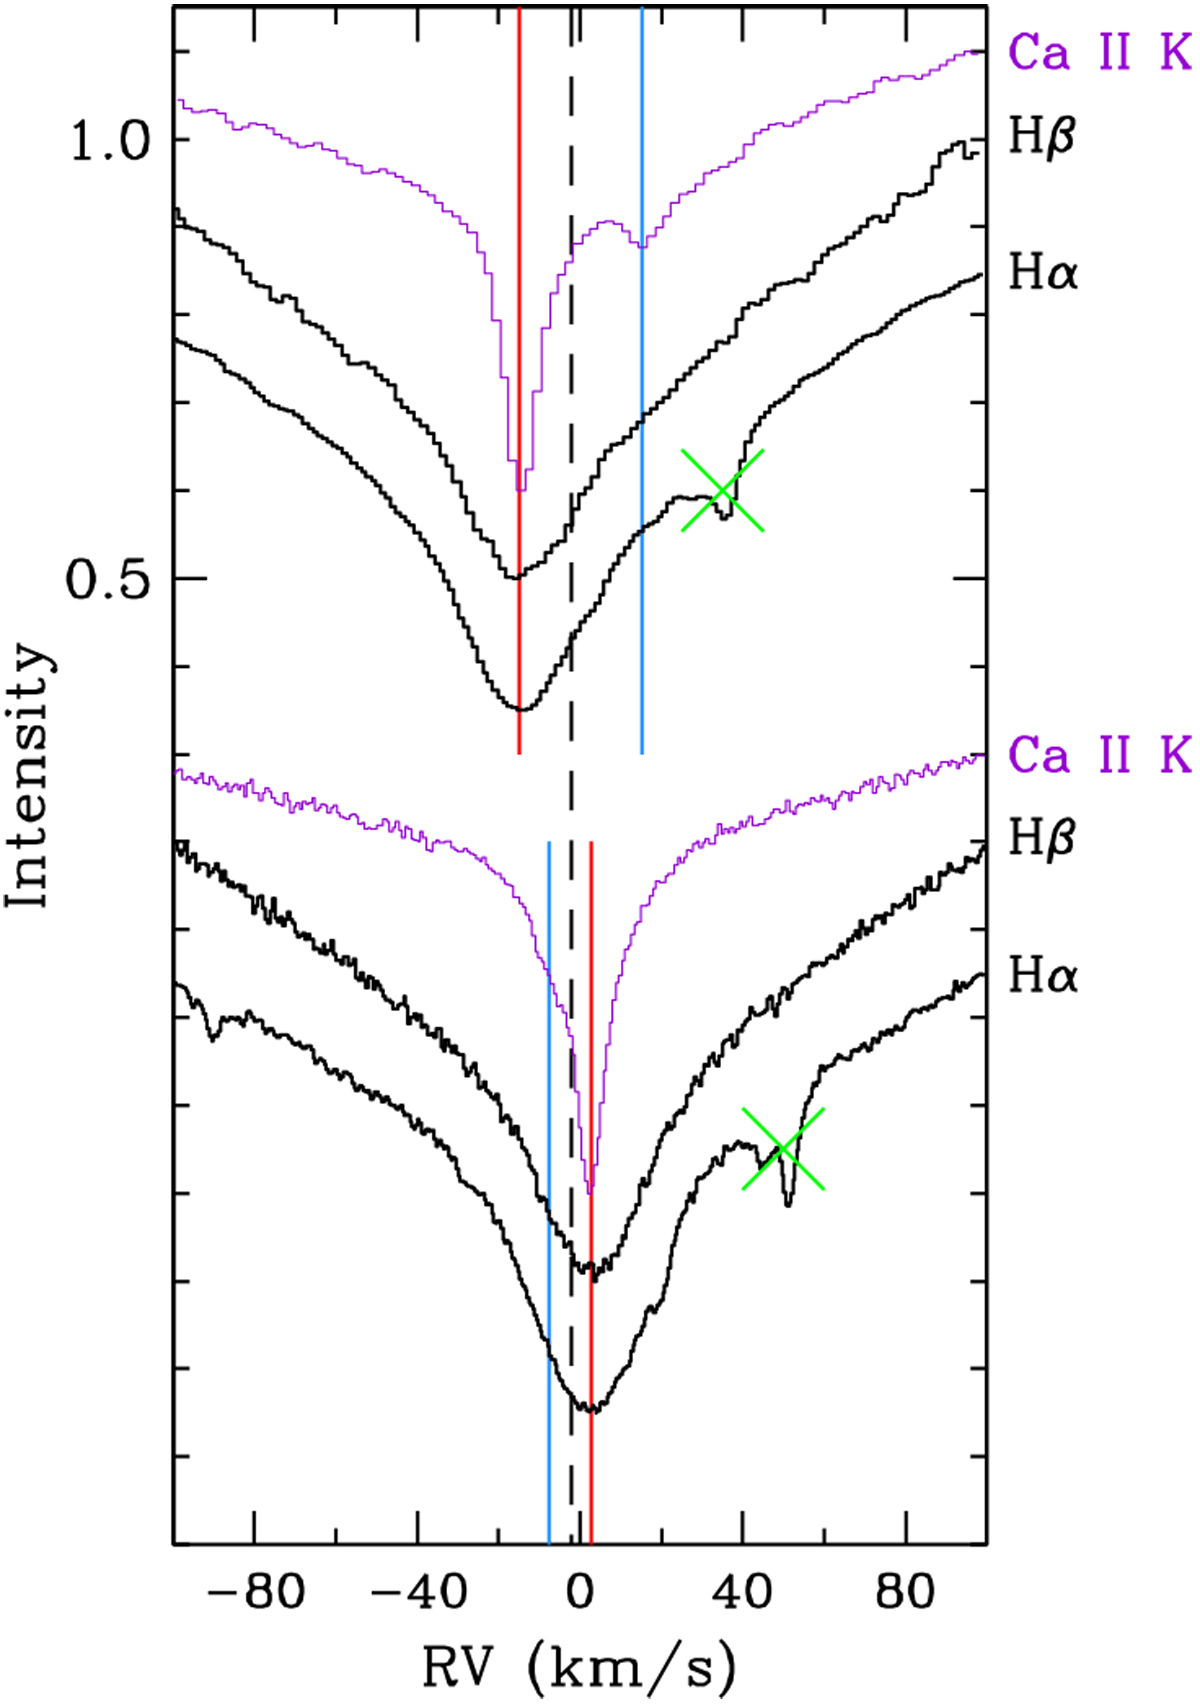
Bottom of the Balmer lines Hα and Hβ for observations corresponding to a configuration where the difference in RVs is large (top) and small (bottom). The red and blue lines mark the radial velocities of the D and S components, measured on the Ca II K narrow absorption features, plotted in purple as references. Those RV are − 14.80 ± 0.50 (D), + 15.16 ± 1.54 km s−1 (S) (top), and + 2.75 ± 0.73 (D), − 7.72 ± 1.38 (S) km s−1 (bottom). The dashed line marks the RV of the system, − 2.18 ± 0.32 km s−1. The two green crosses mark the position of telluric lines.
Current usage metrics show cumulative count of Article Views (full-text article views including HTML views, PDF and ePub downloads, according to the available data) and Abstracts Views on Vision4Press platform.
Data correspond to usage on the plateform after 2015. The current usage metrics is available 48-96 hours after online publication and is updated daily on week days.
Initial download of the metrics may take a while.