Fig. 3
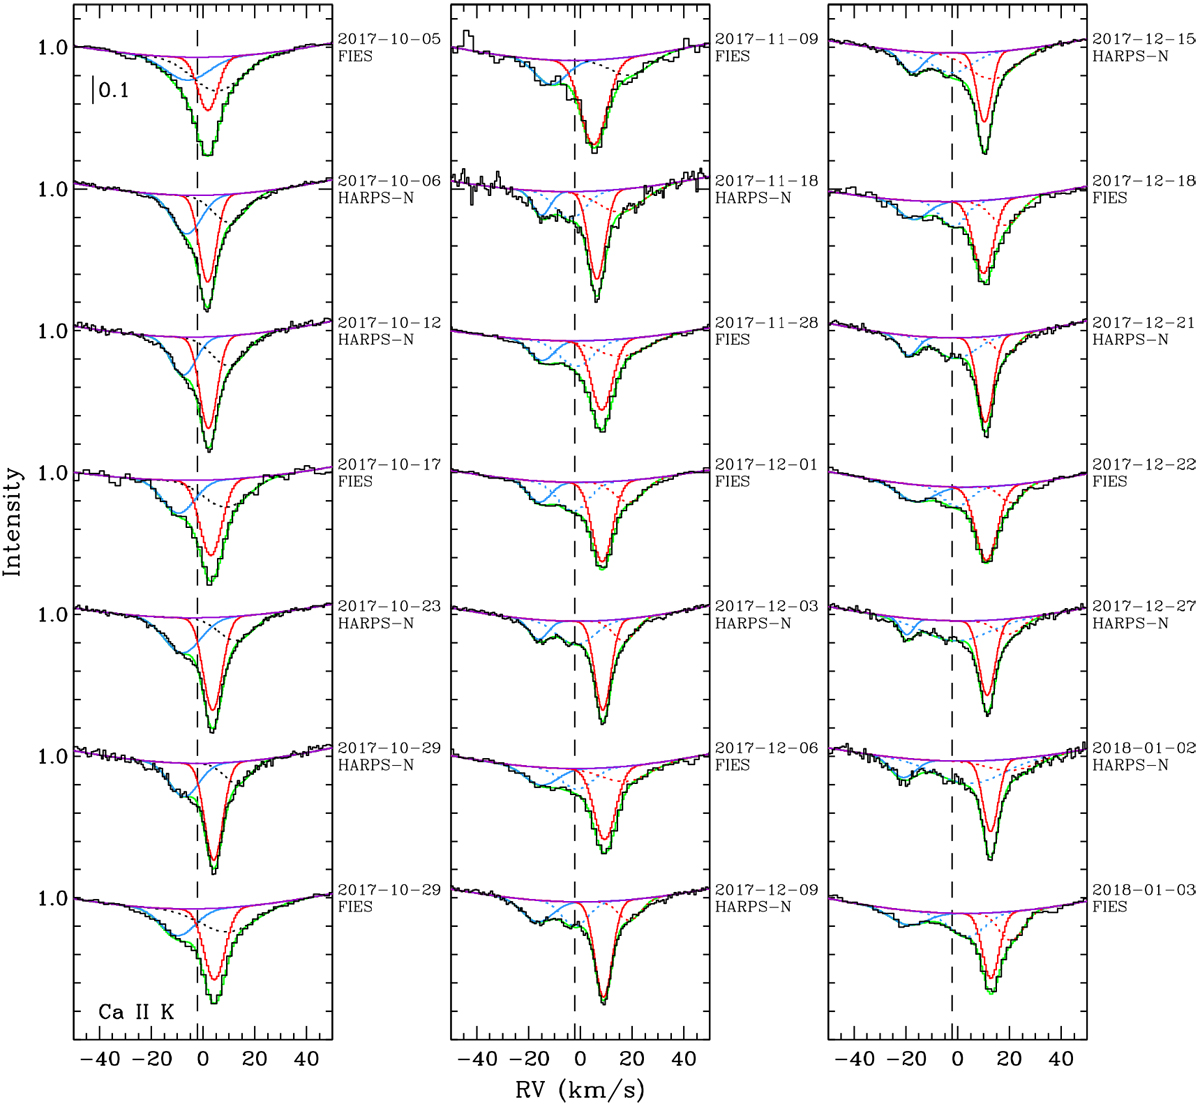
Ca II K CS profile for 21 observations obtained with FIES/NOT and HARPS-N/TNG between 5 Oct 2017 and 3 Jan 2018. The profiles have been decomposed with three or four Gaussians, plotting D (d) and S (s) as solid (dotted) red and blue lines. The pseudocontinuum tracing the bottom of the broad photospheric line is plotted in purple and the fit to the whole profile is plotted in green. For the three-Gaussian fit the additional component has been plotted as a dotted black line. The dashed line marks the RV of the system − 2.18 ± 0.32 km s−1 (see Sect. 6.2 and Table 4).
Current usage metrics show cumulative count of Article Views (full-text article views including HTML views, PDF and ePub downloads, according to the available data) and Abstracts Views on Vision4Press platform.
Data correspond to usage on the plateform after 2015. The current usage metrics is available 48-96 hours after online publication and is updated daily on week days.
Initial download of the metrics may take a while.