Fig. 2
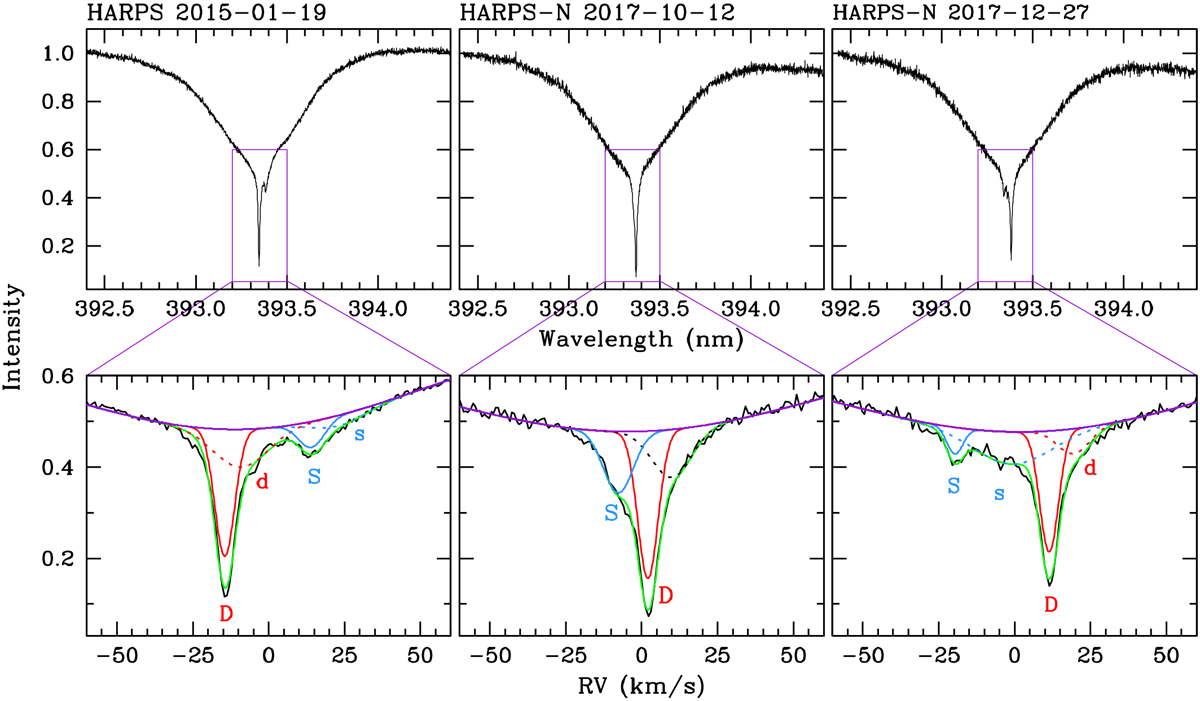
Top: profiles of the broad photospheric Ca II K line of HR 10 of spectra obtained on 19 Jan 2015, 12 Oct 2017 and 27 Dec 2017. Superimposed on the lower part of the lines, narrow absorption features are remarkably conspicuous. Bottom: narrow CS components corresponding to the spectra at the top, plotted in velocity space. The velocity RV = 0 km s−1 corresponds to the rest wavelength of the Ca II K line. The letters D and S label the deep and shallow components of each CS absorption, respectively; these are present in all the spectra analysed in this work. Solid red and blue lines correspond to the Gaussian decomposition of those two main components, the bottom of the photospheric profile is plotted in purple and the whole fit in green. Dotted lines are the additional Gaussians d and s required to complete the decomposition of the absorption. See text for details.
Current usage metrics show cumulative count of Article Views (full-text article views including HTML views, PDF and ePub downloads, according to the available data) and Abstracts Views on Vision4Press platform.
Data correspond to usage on the plateform after 2015. The current usage metrics is available 48-96 hours after online publication and is updated daily on week days.
Initial download of the metrics may take a while.