Fig. 17
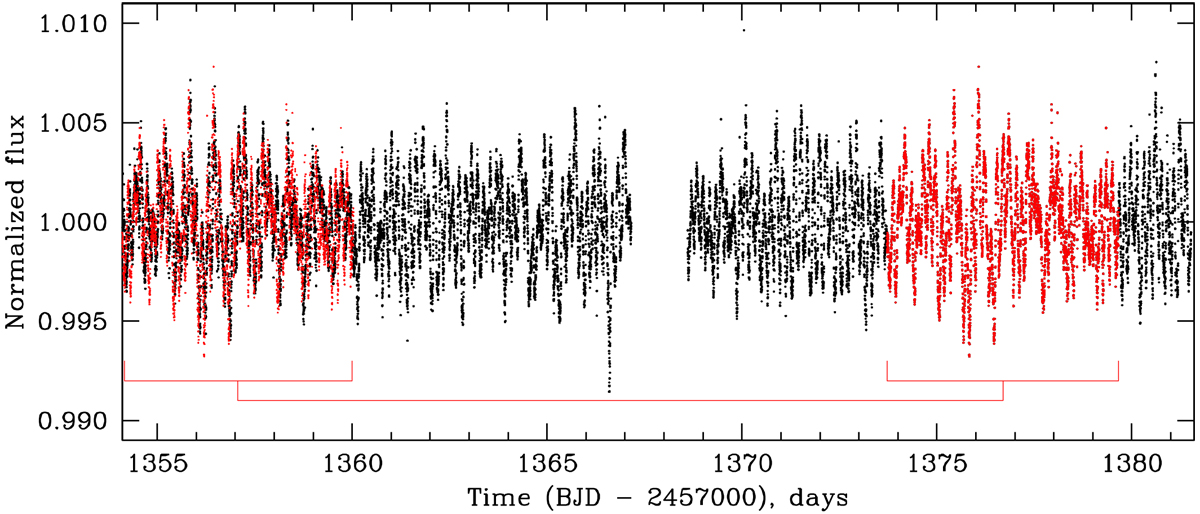
TESS photometric time series, showing the very short-time variability of the HR 10 system. As an example of the repeatibility of the pattern, the observations between days 1373.72 and 1379.66 (in BJD–2 457 000) highlighted in red have been shifted to the interval 1354.11–1360.05, where they are overplotted in red on the original set of data. See text for details.
Current usage metrics show cumulative count of Article Views (full-text article views including HTML views, PDF and ePub downloads, according to the available data) and Abstracts Views on Vision4Press platform.
Data correspond to usage on the plateform after 2015. The current usage metrics is available 48-96 hours after online publication and is updated daily on week days.
Initial download of the metrics may take a while.