Fig. 16
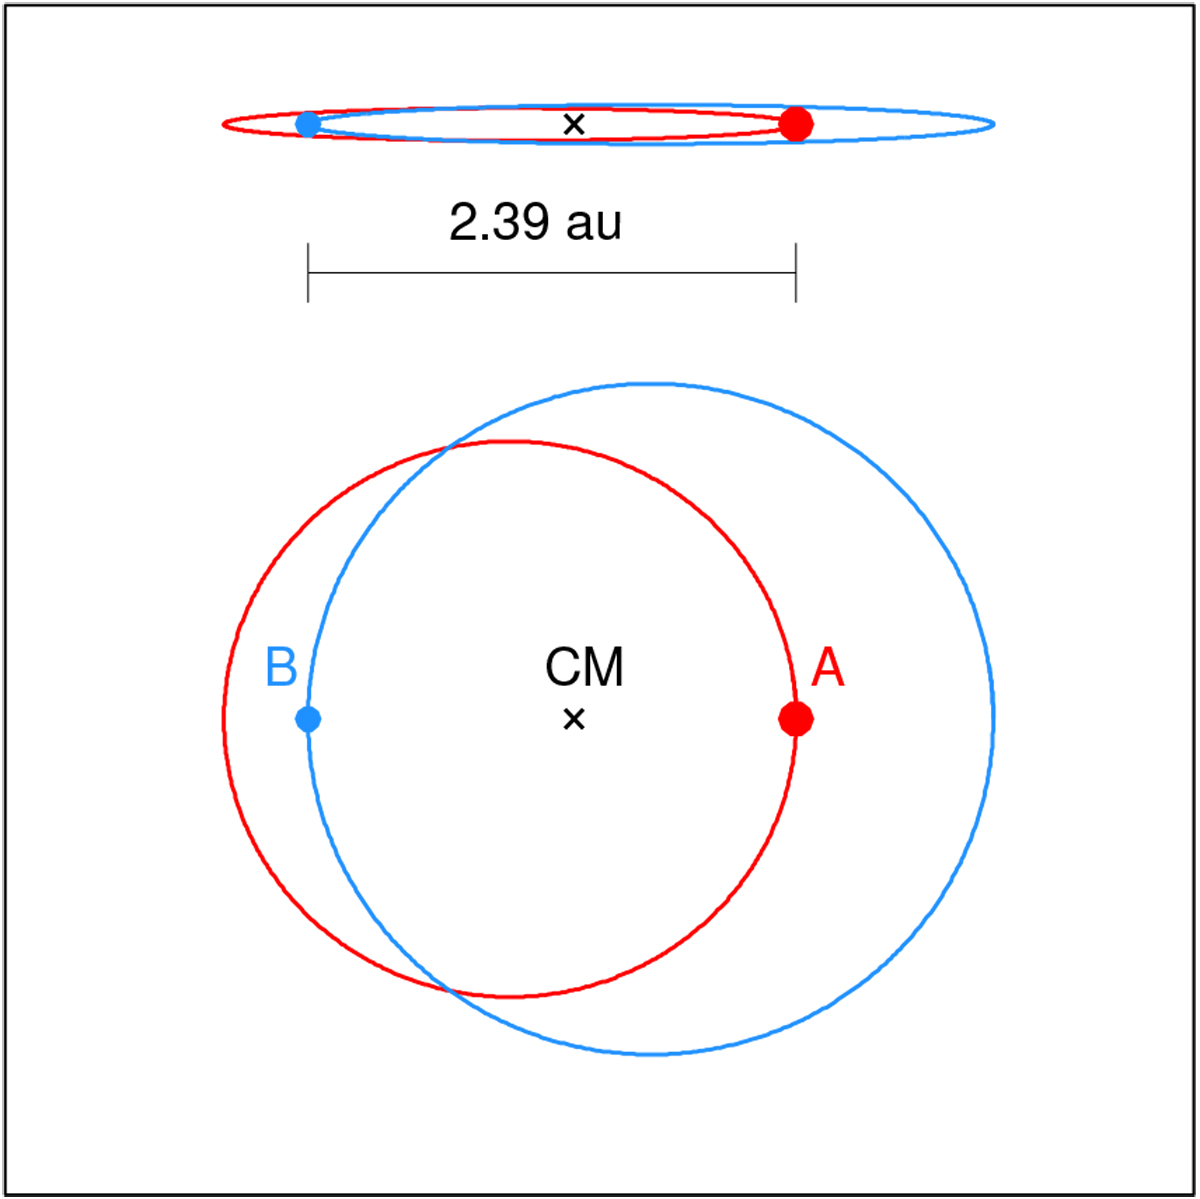
Simple sketch of the orbits of HR 10-A and -B around the centre of mass of the system plotted at scale as they are observed (top) and deprojected onto a plane using the value of the inclination, i, from Table 5. The stars have been located at the corresponding pericentres, i.e. the points where the distance between components A and B is a minimum (~ 2.39 au).
Current usage metrics show cumulative count of Article Views (full-text article views including HTML views, PDF and ePub downloads, according to the available data) and Abstracts Views on Vision4Press platform.
Data correspond to usage on the plateform after 2015. The current usage metrics is available 48-96 hours after online publication and is updated daily on week days.
Initial download of the metrics may take a while.