Free Access
Fig. 13
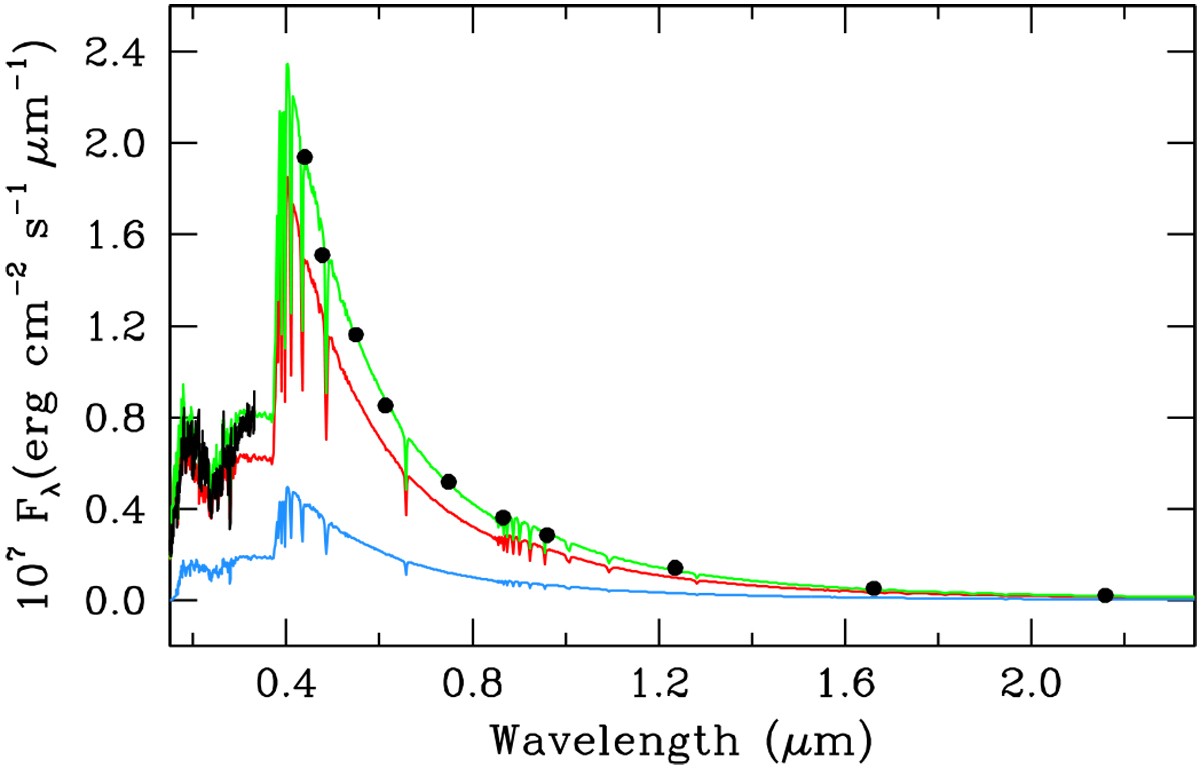
Spectral energy distribution (SED) of HR 10 and the adopted solution. The observed optical and NIR photometry and the ultraviolet IUE spectrum SWP38943 + LWP18015 are plotted in black. The models for stars A and B and the combined solution are plotted in red, blue, and green, respectively.
Current usage metrics show cumulative count of Article Views (full-text article views including HTML views, PDF and ePub downloads, according to the available data) and Abstracts Views on Vision4Press platform.
Data correspond to usage on the plateform after 2015. The current usage metrics is available 48-96 hours after online publication and is updated daily on week days.
Initial download of the metrics may take a while.