Fig. 12
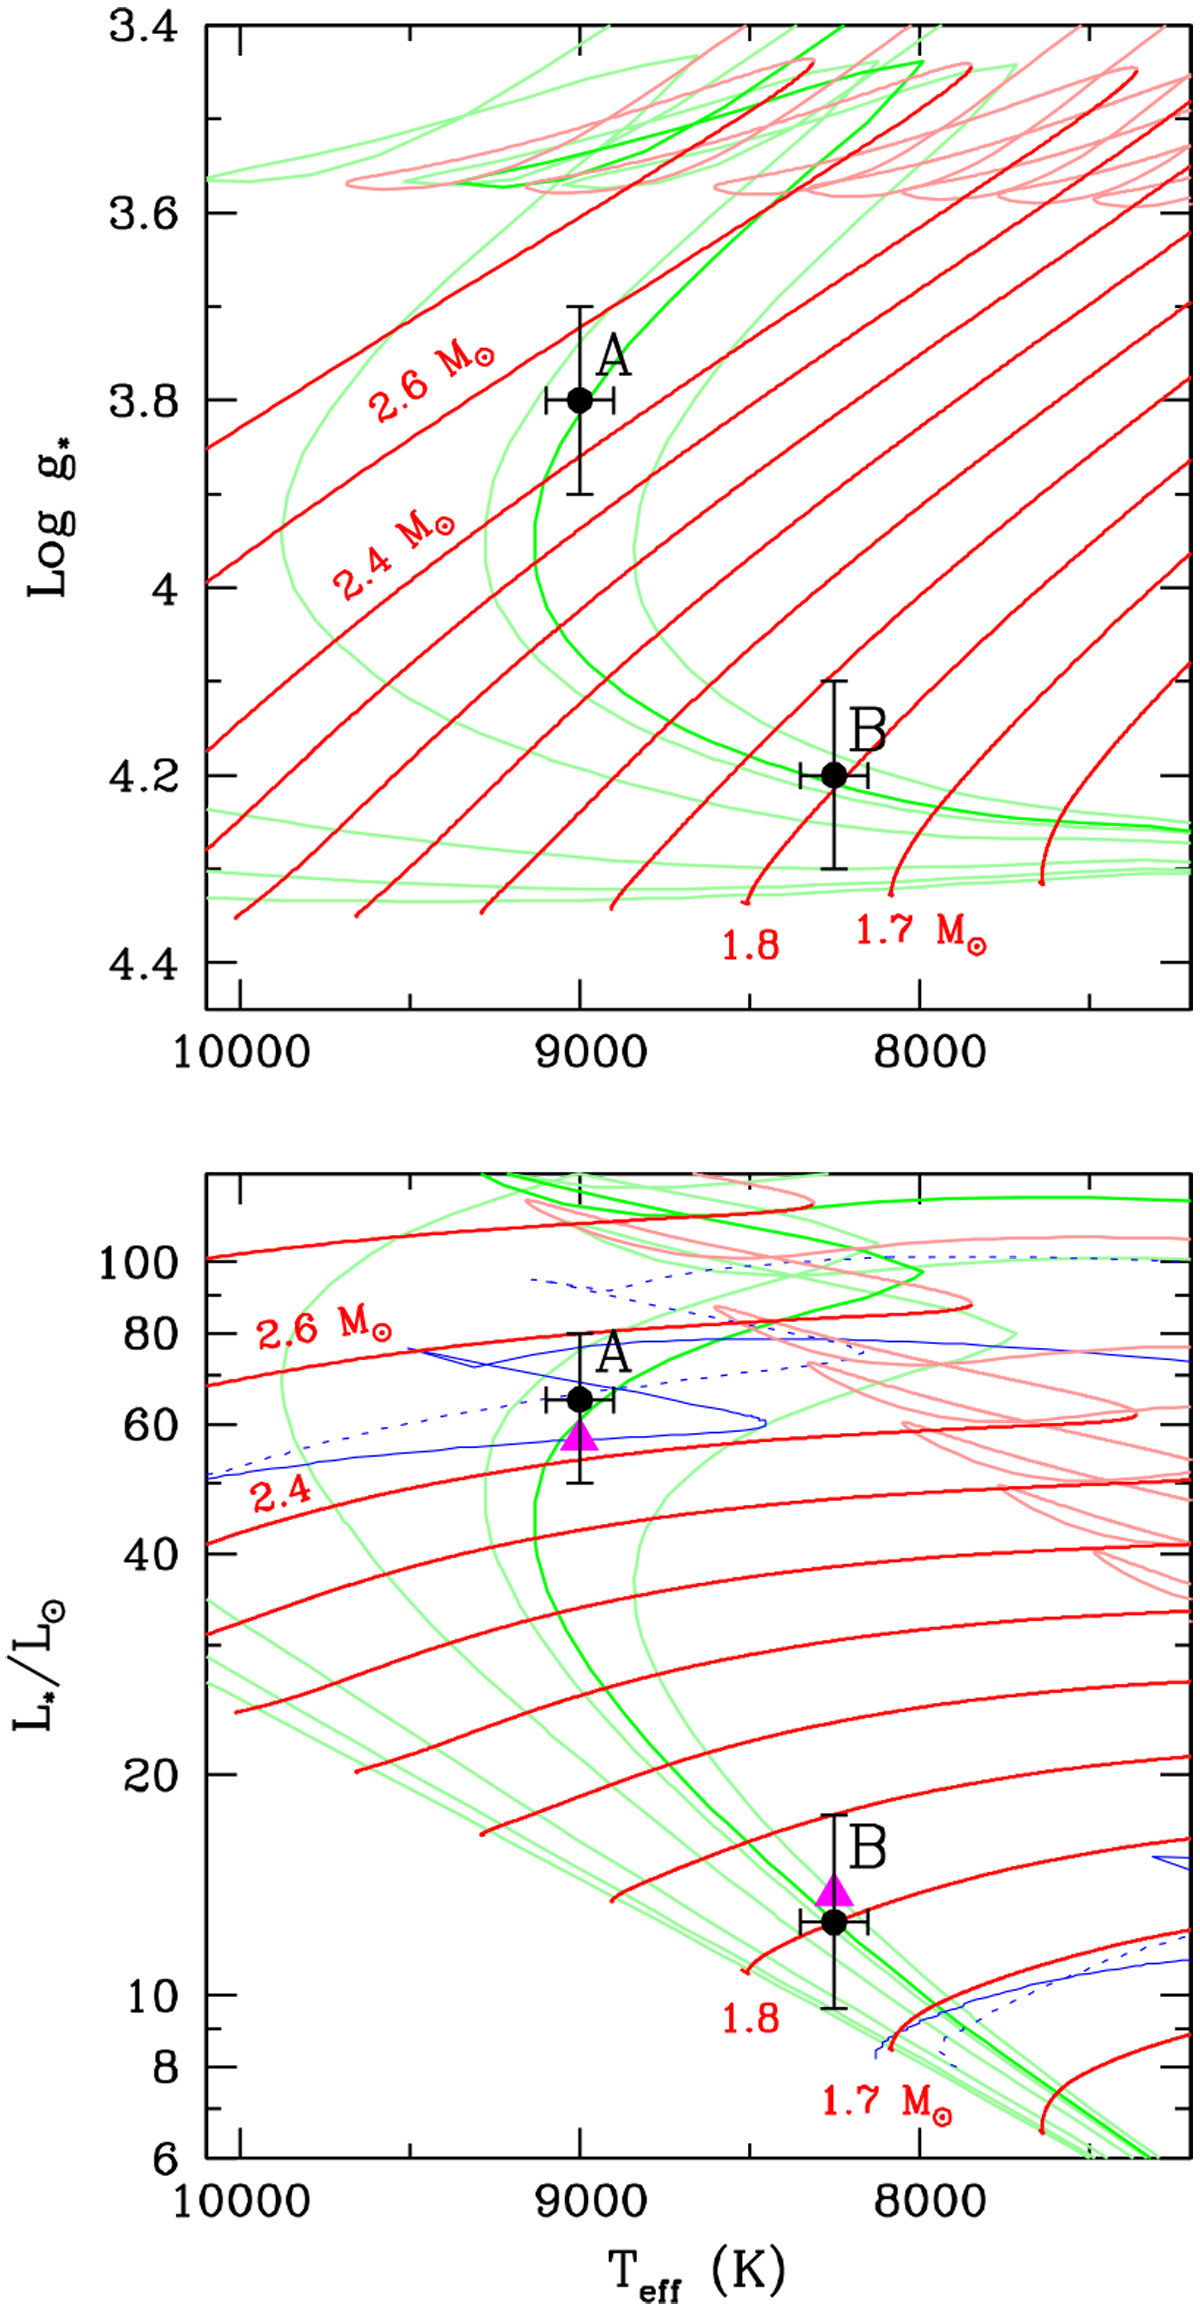
HR diagrams log g*–Teff (top) and L*∕L⊙ (bottom) and the positions of the individual components of HR 10. PARSEC V2.1s evolutionary tracks (red) and isochrones (green) are used. Isochrones correspond to 50, 100, 200, 400, 500, 530 (highlighted) and 600 Myr. Solid (dotted) blue lines in the lower panel are the evolutionary tracks with no rotation (rotation) for stars with 1.7 and 2.5 M⊙ from Ekström et al. (2012) (see Sect. 7.5). The two magenta triangles in the lower HR diagram show luminosities, described below in the main text.
Current usage metrics show cumulative count of Article Views (full-text article views including HTML views, PDF and ePub downloads, according to the available data) and Abstracts Views on Vision4Press platform.
Data correspond to usage on the plateform after 2015. The current usage metrics is available 48-96 hours after online publication and is updated daily on week days.
Initial download of the metrics may take a while.