Fig. 11
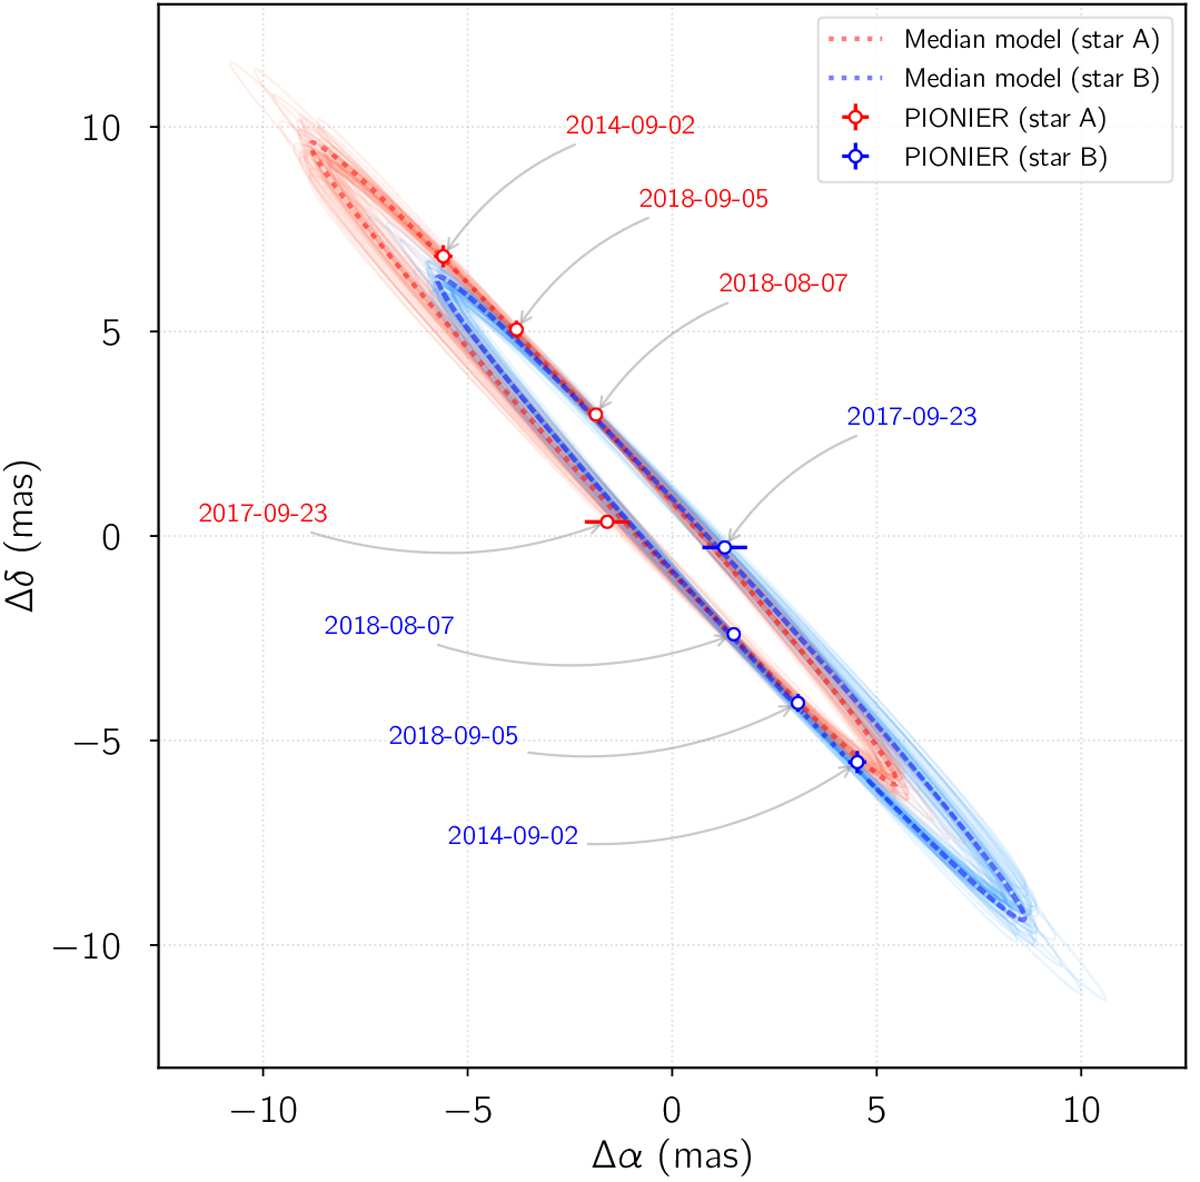
PIONIER/VLTI astrometric positions for the two components of the HR10 resolved binary system (circle symbols include errorbars). The date for each observation is specified. A sample of 100 orbital solutions obtained from the posterior distributions derived in Sect 6.3 (see Table 5), are represented by the colour-coded thin lines. The median models are represented by thick dashed lines.
Current usage metrics show cumulative count of Article Views (full-text article views including HTML views, PDF and ePub downloads, according to the available data) and Abstracts Views on Vision4Press platform.
Data correspond to usage on the plateform after 2015. The current usage metrics is available 48-96 hours after online publication and is updated daily on week days.
Initial download of the metrics may take a while.