Fig. 9.
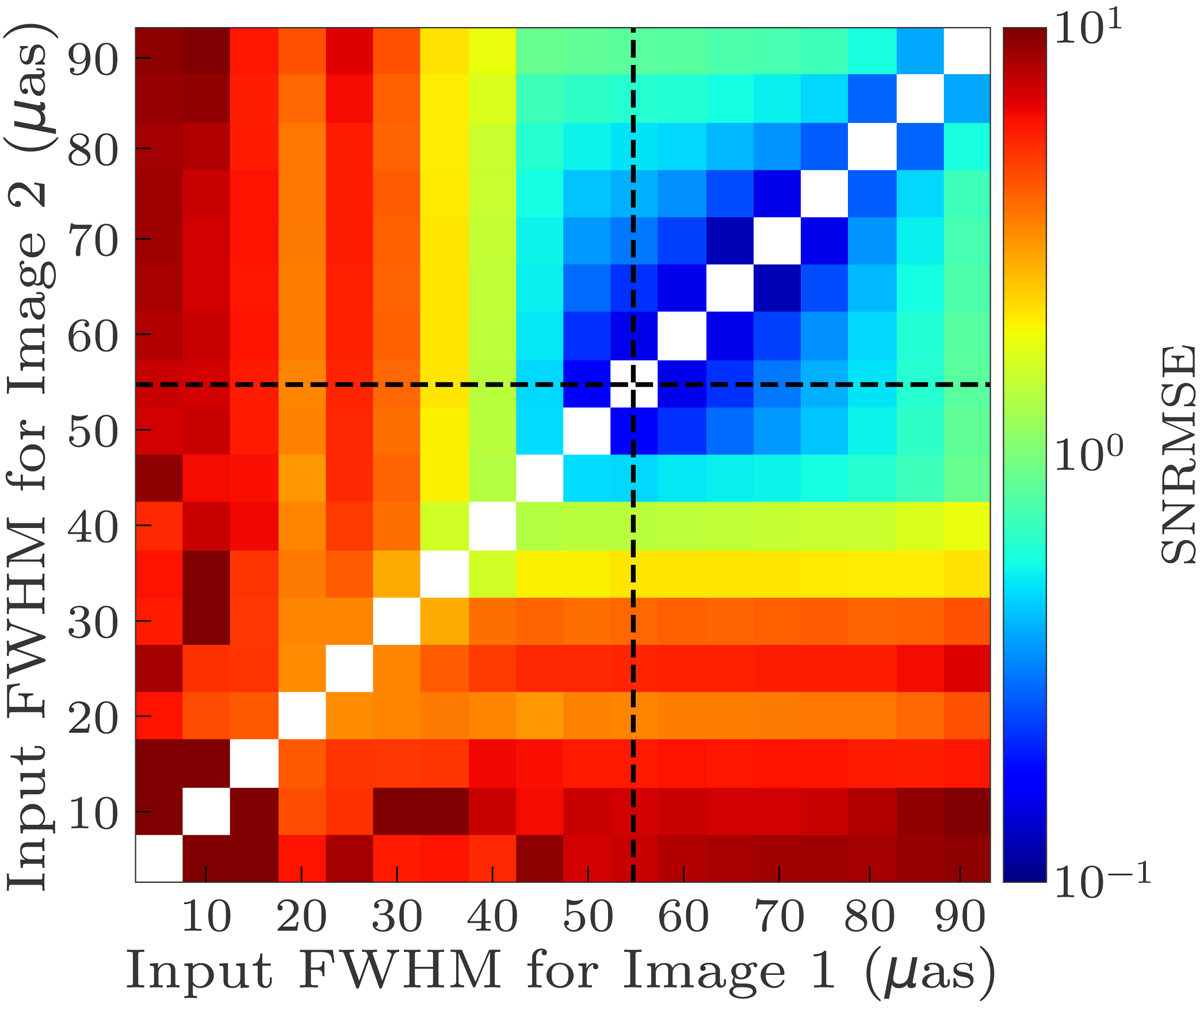
Cross-comparisons of reconstructed images with varying isotropic input FWHMs using symmetrically normalized root-mean-square error (SNRMSE). The SNRMSE grid shows a greater correspondence of images with input FWHMs near the true mean FWHM of 55 μas, marked by the dashed black lines. The reconstructed images with varying input size (5–90 μas) are all compared to each other, where image 1 and image 2 are the two images to be compared (![]() and
and ![]() respectively in Eq. (19)). The diagonal is each image compared to itself. The SNRMSE grid gives a range of plausible input FWHMs for ℛΣ that result in high fidelity images even when the true source size is unknown.
respectively in Eq. (19)). The diagonal is each image compared to itself. The SNRMSE grid gives a range of plausible input FWHMs for ℛΣ that result in high fidelity images even when the true source size is unknown.
Current usage metrics show cumulative count of Article Views (full-text article views including HTML views, PDF and ePub downloads, according to the available data) and Abstracts Views on Vision4Press platform.
Data correspond to usage on the plateform after 2015. The current usage metrics is available 48-96 hours after online publication and is updated daily on week days.
Initial download of the metrics may take a while.