Fig. 8.
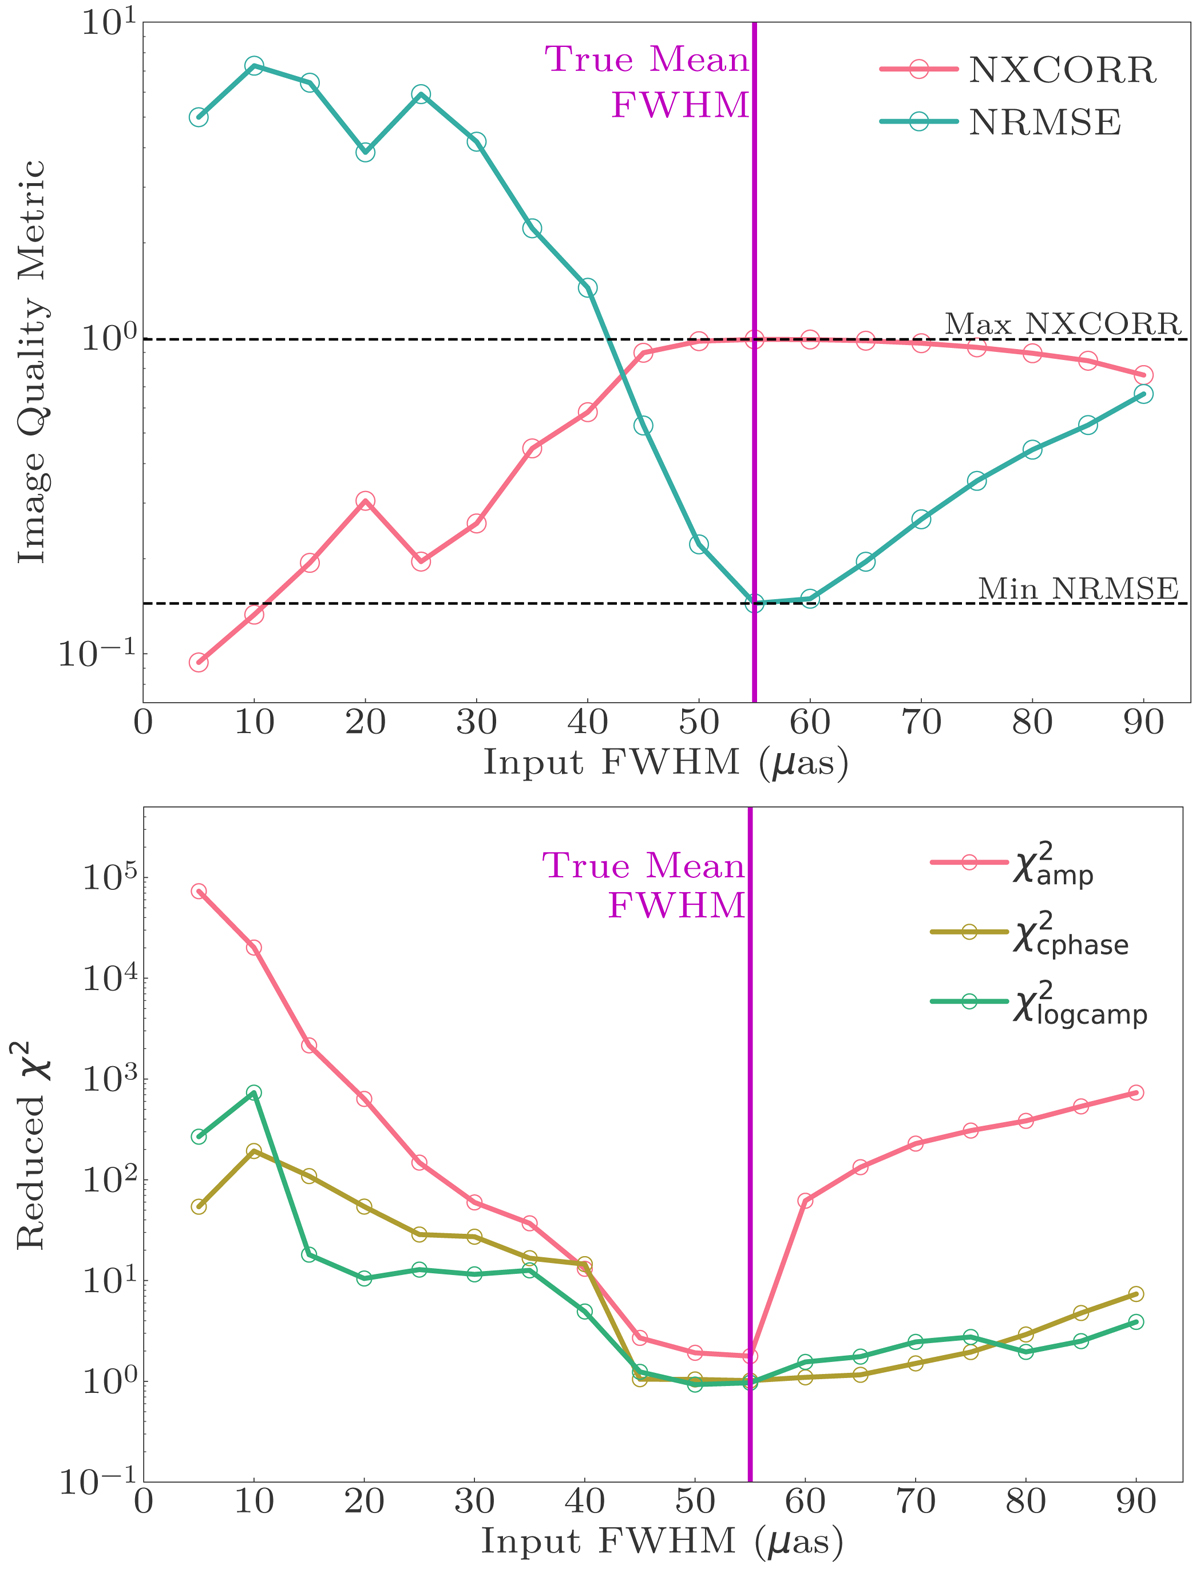
Quality of the images obtained with different input FWHM (major and minor axes equal, position angle is zero). The image quality is measured in three ways: (1) the normalized cross-correlation against the true image, or NXCORR; (2) the normalized root-mean-square error against the true image, or NRMSE, shown in the top panel; and (3) reduced χ2 goodness-of-fits to the three data products used in the reconstructions (visibility amplitudes, closure amplitudes and phases) shown in the bottom panel. NRMSE is more sensitive to subtle differences in the images than NXCORR due to the higher weight associated with large pixel-by-pixel errors and is minimized in a comparable range of input FWHMs to the reduced data χ2. The narrow range of FWHMs encompasses the true mean source FWHM (magenta vertical line).
Current usage metrics show cumulative count of Article Views (full-text article views including HTML views, PDF and ePub downloads, according to the available data) and Abstracts Views on Vision4Press platform.
Data correspond to usage on the plateform after 2015. The current usage metrics is available 48-96 hours after online publication and is updated daily on week days.
Initial download of the metrics may take a while.