Fig. 5.
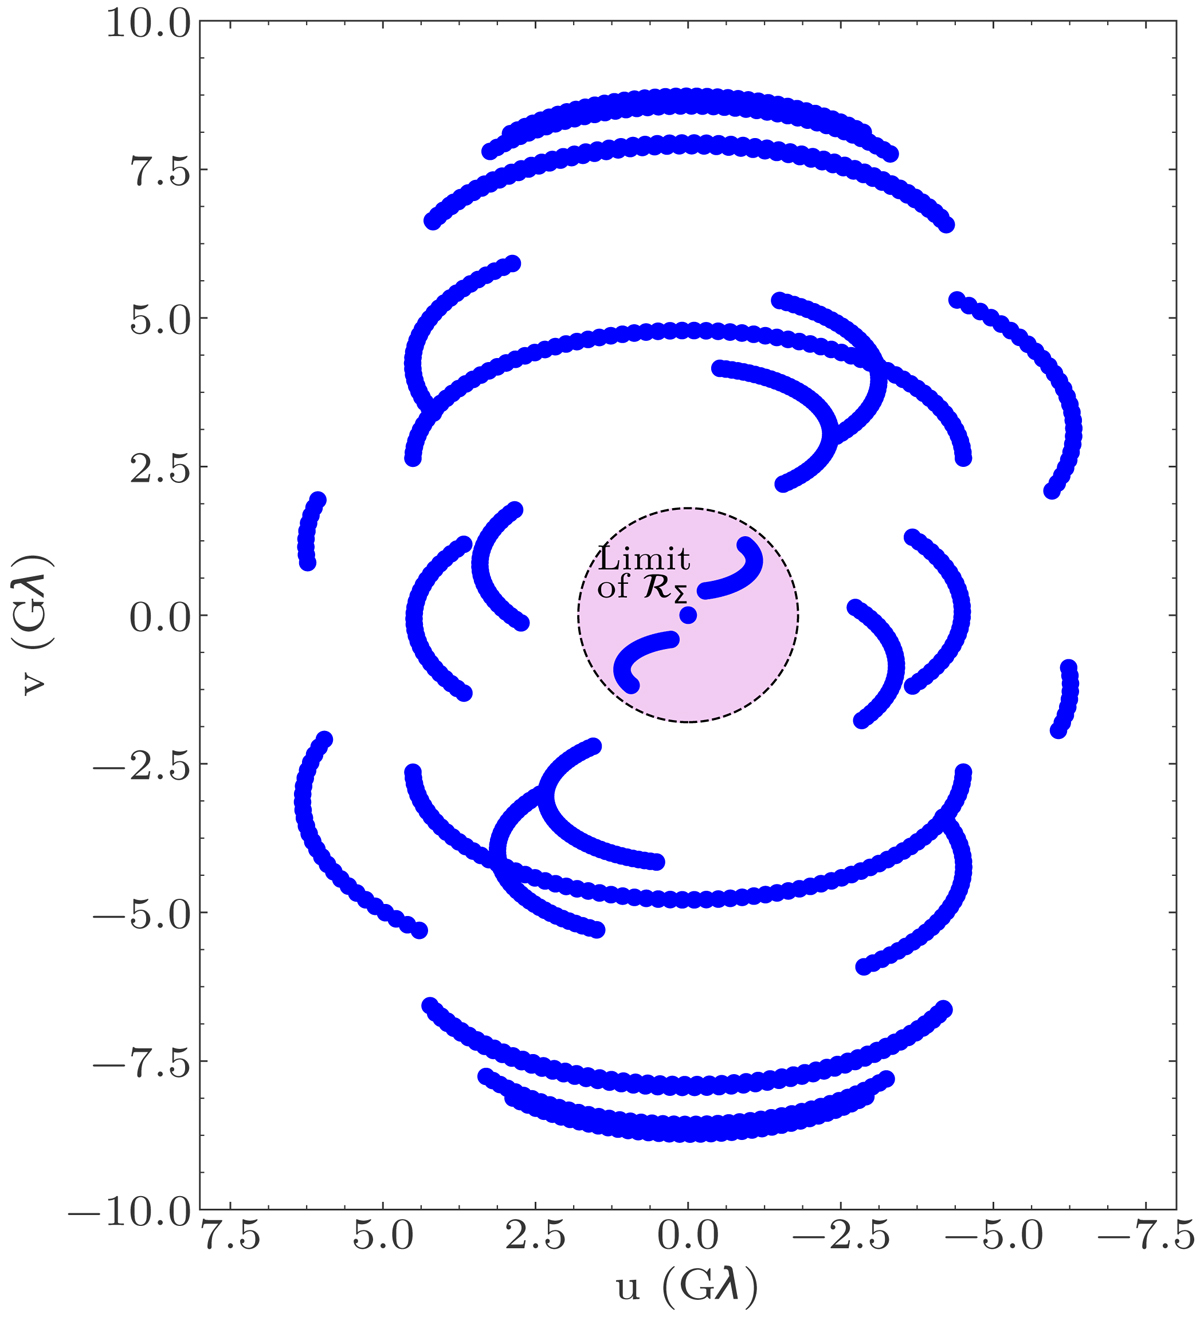
(u, v) coverage for simulated observations of Sgr A* with the EHT 2017 array at 230 GHz. The magenta disk represents the range of (u, v) constrained by the second moment regularization, with the boundary at the 1/e point of the corresponding visibility amplitude function for Sgr A* assuming an isotropic source of 60 μas FWHM (Johnson et al. 2018).
Current usage metrics show cumulative count of Article Views (full-text article views including HTML views, PDF and ePub downloads, according to the available data) and Abstracts Views on Vision4Press platform.
Data correspond to usage on the plateform after 2015. The current usage metrics is available 48-96 hours after online publication and is updated daily on week days.
Initial download of the metrics may take a while.