Fig. 4.
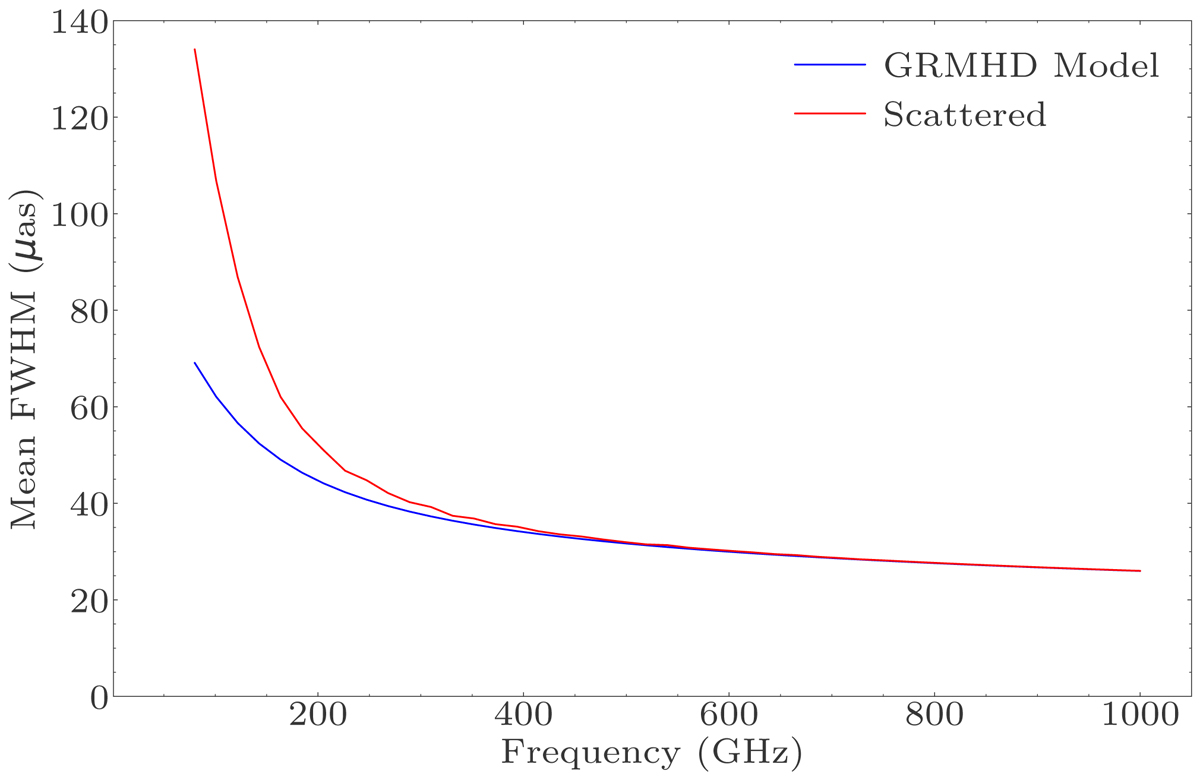
Geometric mean FWHM of principal axes as a function of frequency for the ray-traced simulation of Sgr A* in Fig. 2 (Mościbrodzka & Gammie 2018). The blue curve shows size evolution for the simulation, the red curve shows size evolution for the simulation including the effects of interstellar scattering (Johnson 2016; Johnson et al. 2018). The sizes were obtained from measurements of the image second moment per frequency bin of 20 GHz. The change in size with increasing frequency becomes greatly reduced at frequencies above 300 GHz, where the size of the source is dominated by the achromatic black hole shadow and the Doppler boosted features (Falcke et al. 2000).
Current usage metrics show cumulative count of Article Views (full-text article views including HTML views, PDF and ePub downloads, according to the available data) and Abstracts Views on Vision4Press platform.
Data correspond to usage on the plateform after 2015. The current usage metrics is available 48-96 hours after online publication and is updated daily on week days.
Initial download of the metrics may take a while.