Fig. 11.
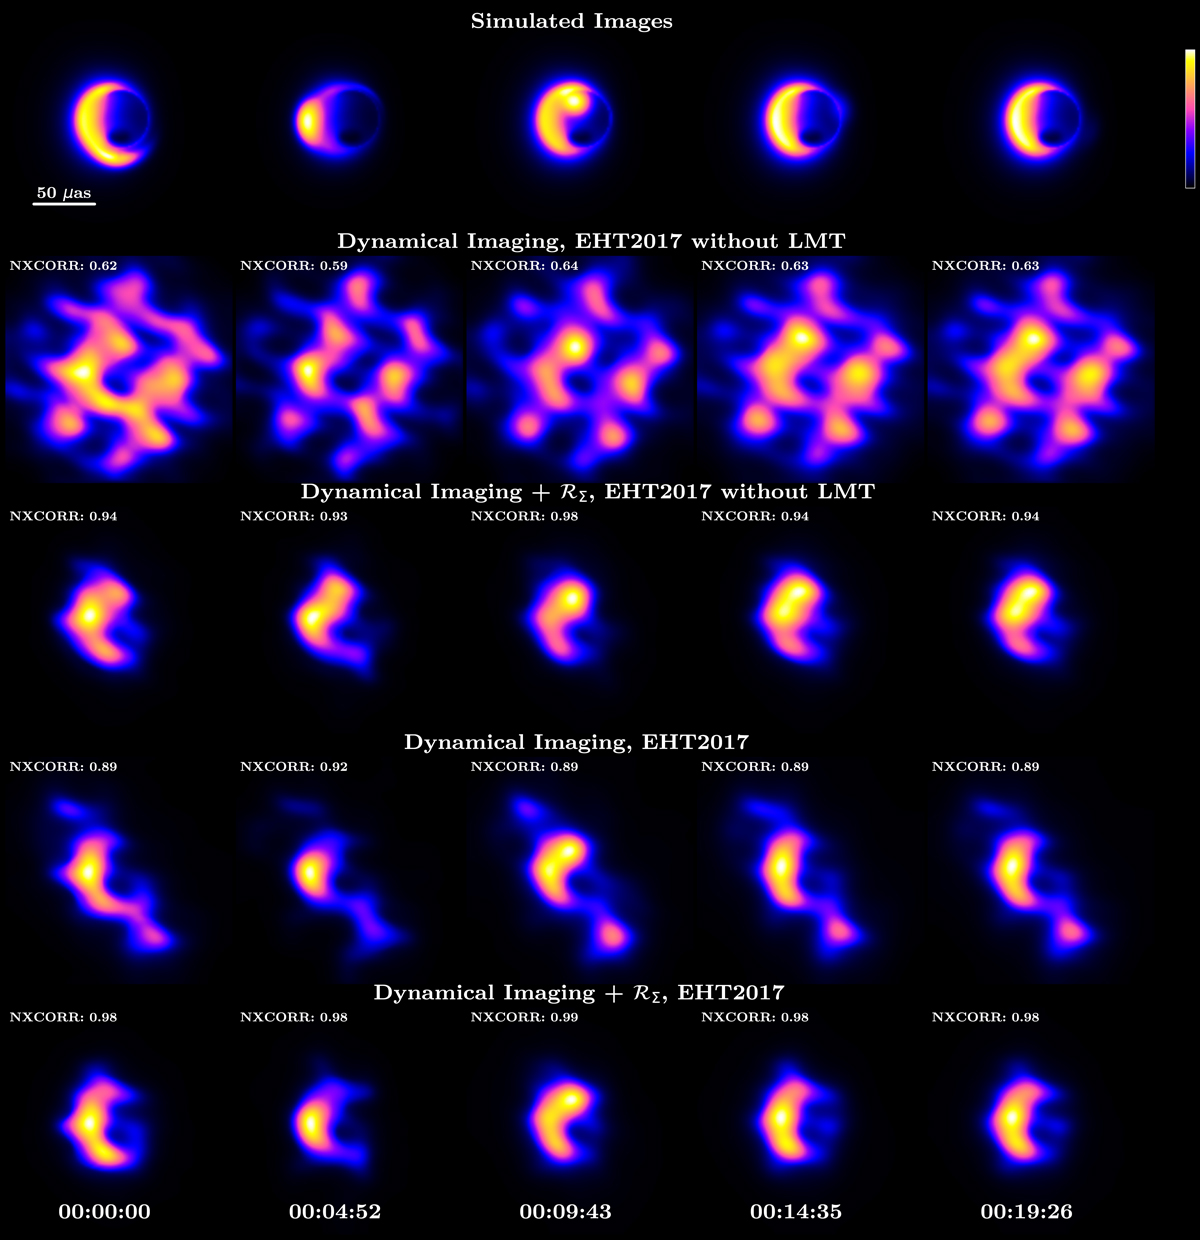
Reconstruction of a simulated flare using dynamical imaging (Johnson et al. 2017). From top to bottom: simulated images of a flare with a period of 27 min (model B of Doeleman et al. 2009); simple dynamical imaging without the LMT (no short-baseline points constraining the source extent); dynamical imaging using ℛΣ without the LMT (the second moment regularization offsets the lack of short-baseline constraints); simple dynamical imaging with full EHT2017 sampling; dynamical imaging using ℛΣ with EHT2017 sampling. Using ℛΣ significantly improved the quality of dynamical reconstructions both with the full array and without the LMT. NXCORR values against the model images are shown in the top left corner for each reconstructed snapshot. The variations in the resulting FWHMs of the reconstructed images are visually evident.
Current usage metrics show cumulative count of Article Views (full-text article views including HTML views, PDF and ePub downloads, according to the available data) and Abstracts Views on Vision4Press platform.
Data correspond to usage on the plateform after 2015. The current usage metrics is available 48-96 hours after online publication and is updated daily on week days.
Initial download of the metrics may take a while.