Fig. 2.
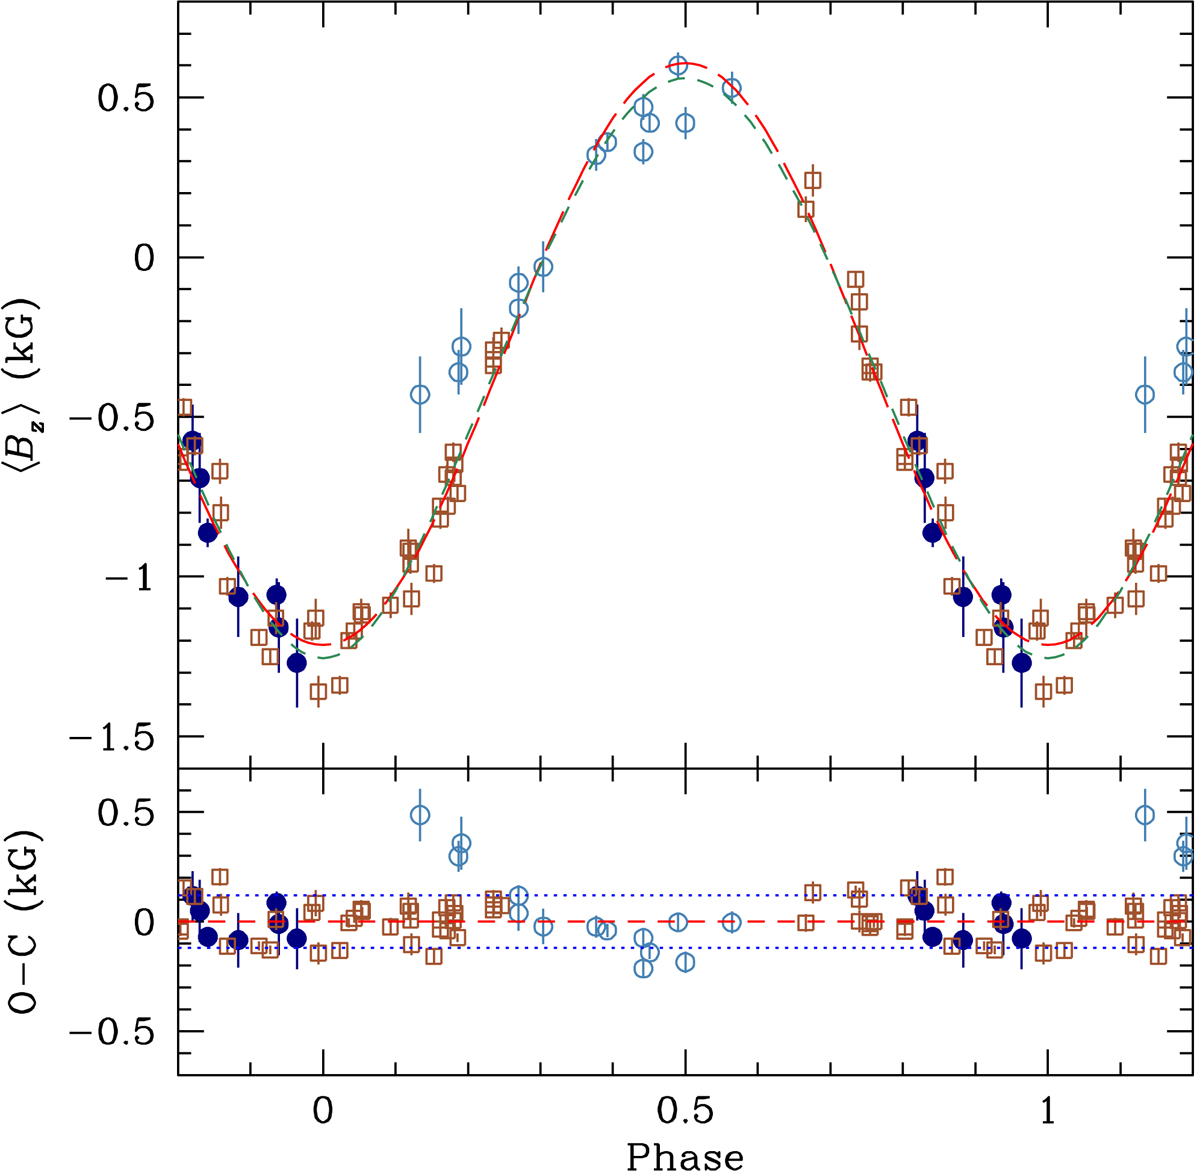
Upper panel: mean longitudinal magnetic field of HD 965 against rotation phase. To distinguish measurements obtained at similar phases in different cycles, circles (blue) were used to identify observations acquired until 2008; squares (brown) correspond to spectra taken since 2009. Filled symbols are used for the measurements of Mathys (2017), and open symbols for all determinations based on SAO spectra. The long-dashed line (red) is the best fit of the observations by a cosine wave, see Eq. (4). The short-dashed line (dark green) corresponds to the superposition of low-order multipoles discussed in Sect. 4. Lower panel: differences O − C between individual ⟨Bz⟩ measurements and best fit curve, against rotation phase. The dotted lines (blue) correspond to ±1 rms deviation of the observational data about the fit (red dashed line). The symbols are the same as in the upper panel.
Current usage metrics show cumulative count of Article Views (full-text article views including HTML views, PDF and ePub downloads, according to the available data) and Abstracts Views on Vision4Press platform.
Data correspond to usage on the plateform after 2015. The current usage metrics is available 48-96 hours after online publication and is updated daily on week days.
Initial download of the metrics may take a while.