Fig. D.2.
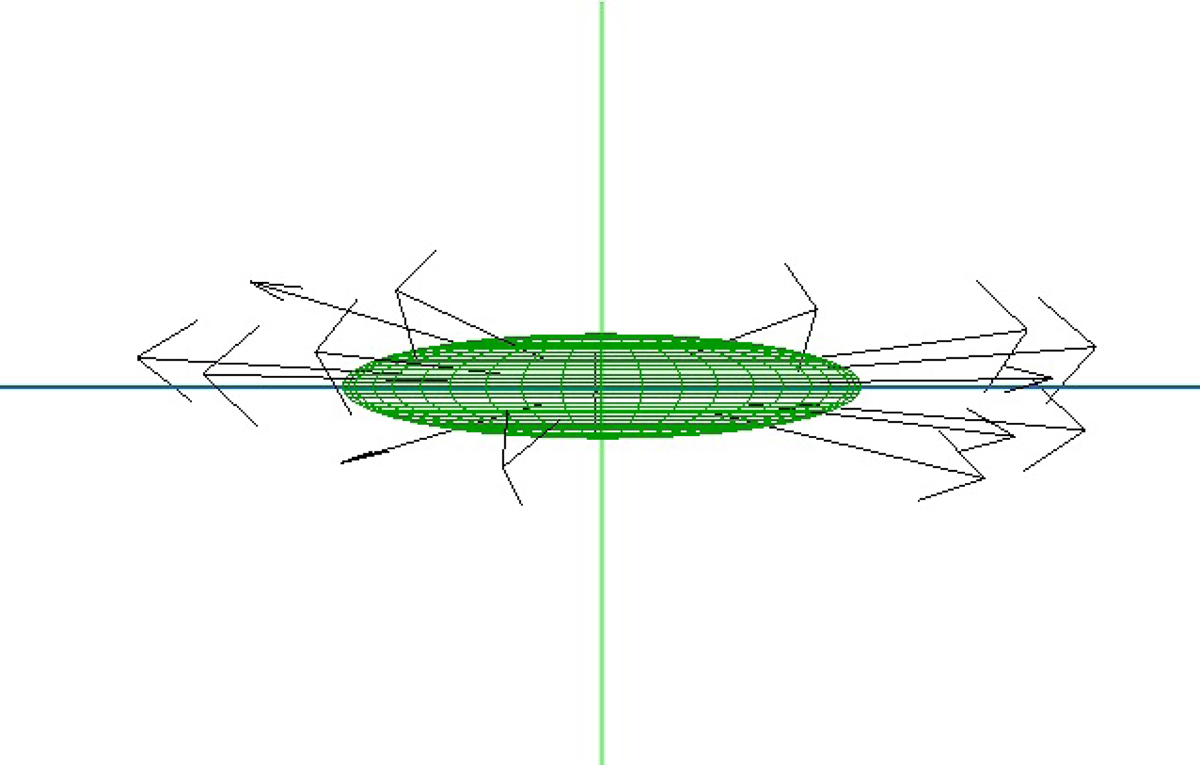
Velocity field vectors (arrows) indicating the expansion of the molecular envelope of τ4 Ser, which is defined by an edge-on oblate spheroid. View from the direction defined by west in the plane of the sky (the observer is on the left). The Y and Z axes are represented by green and blue, respectively. As in the case of AQ Sgr, the expansion is predominantly equatorial, with higher velocities in equatorial regions than those in the poles.
Current usage metrics show cumulative count of Article Views (full-text article views including HTML views, PDF and ePub downloads, according to the available data) and Abstracts Views on Vision4Press platform.
Data correspond to usage on the plateform after 2015. The current usage metrics is available 48-96 hours after online publication and is updated daily on week days.
Initial download of the metrics may take a while.