Fig. 3
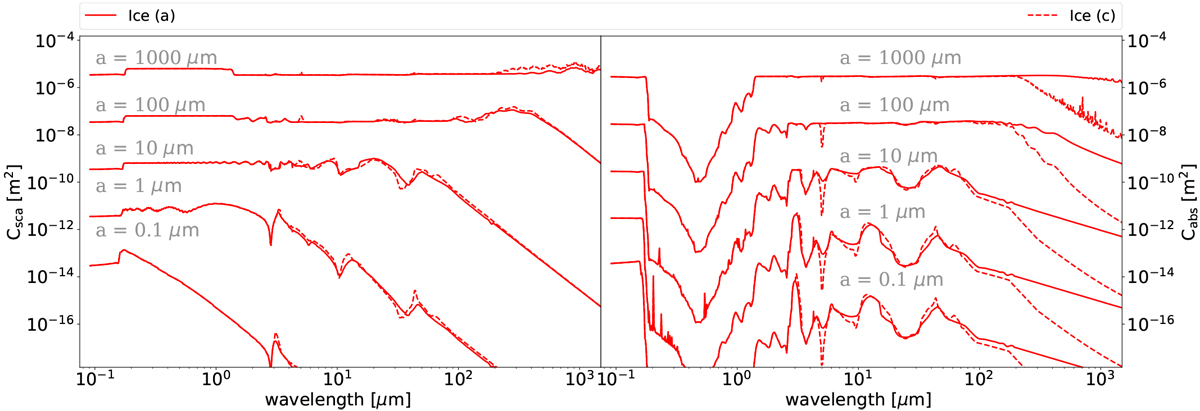
Assumed scattering and absorption cross sections (Csca and Cabs, respectively) of amorphous ice (solid lines) and crystalline ice (dashed lines) for different grain sizes. The individual grain size is indicated in each plot. For reference to the underlying complex refractive indices, resulting from laboratory measurements, see Table 1.
Current usage metrics show cumulative count of Article Views (full-text article views including HTML views, PDF and ePub downloads, according to the available data) and Abstracts Views on Vision4Press platform.
Data correspond to usage on the plateform after 2015. The current usage metrics is available 48-96 hours after online publication and is updated daily on week days.
Initial download of the metrics may take a while.