Fig. 1.
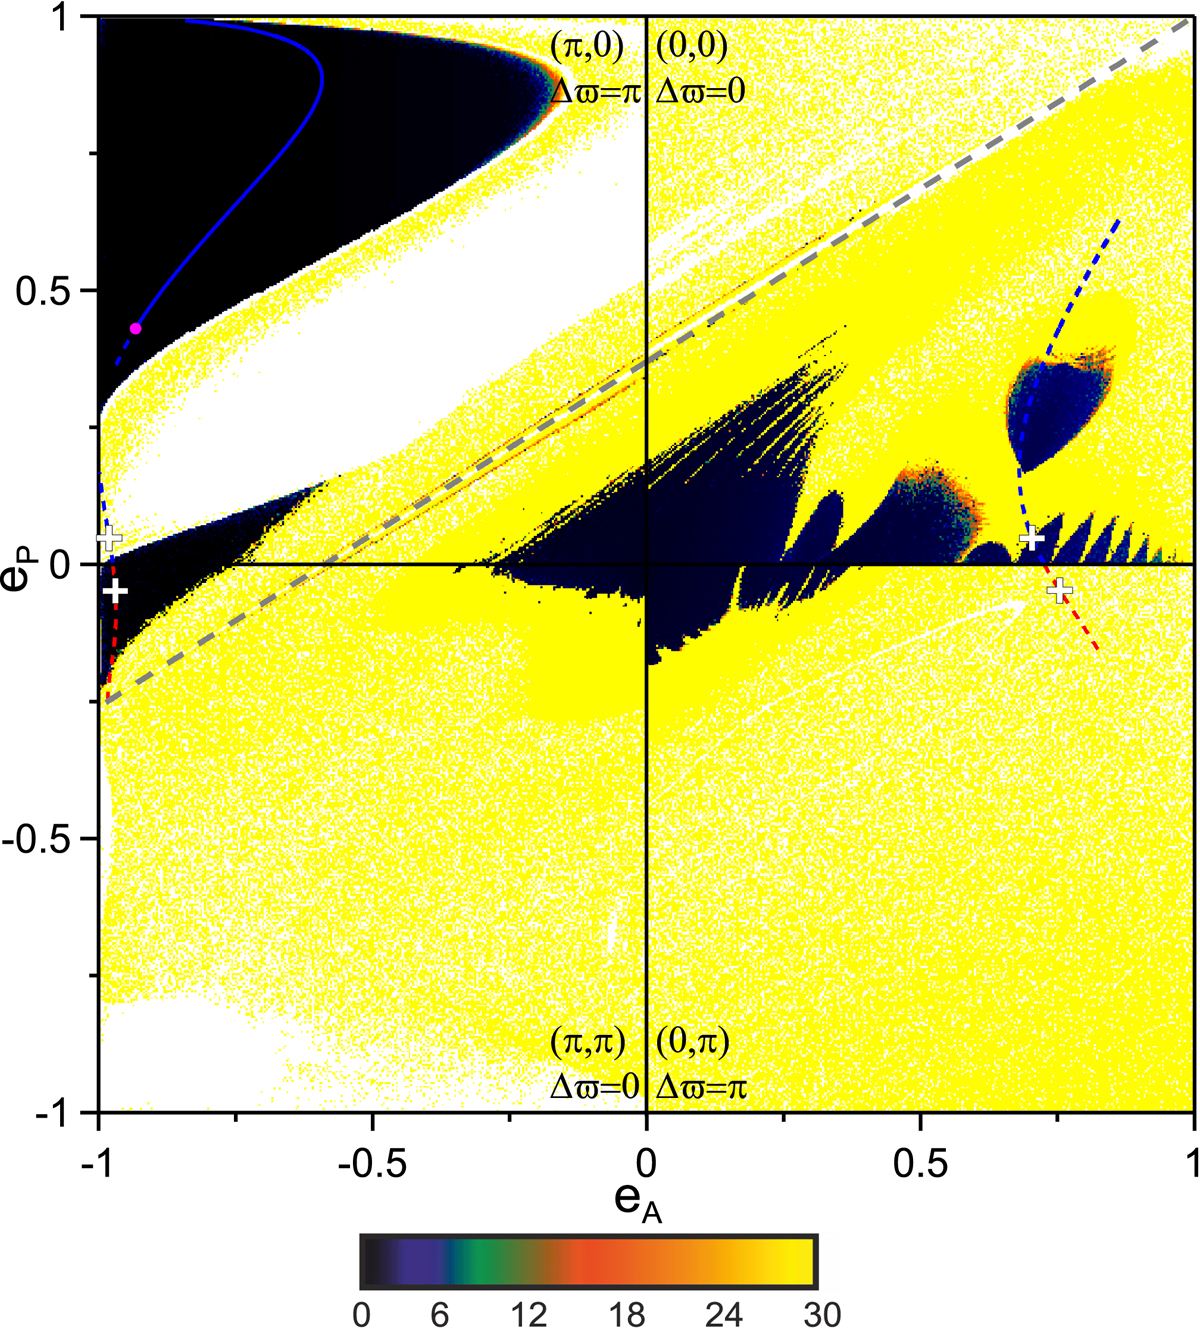
Families of symmetric periodic orbits in 2:1 MMR of the 2D-ERTBP when mP = mJ are overplotted on the DS maps of the plane (eA, eP). The white crosses represent the chosen periodic orbits for our study, the orbital elements of which remain fixed for the computation of each map. We use a positive (or negative) value for eA when θ1 equals 0 (or π) in the family of each configuration. The same convention applies to eP and θ2. Dark (pale) regions correspond to stable (chaotic) domains in phase space as attributed by the logarithmic values of the DFLI shown by the colored bar. Blue (red) curves stand for the horizontal stability (instability) of the periodic orbits, while the solid (dashed) curves show the vertical stability (instability). The magenta dot corresponds to a transition of the vertical stability. The dashed gray curve depicts the collision line between the planet and the asteroid.
Current usage metrics show cumulative count of Article Views (full-text article views including HTML views, PDF and ePub downloads, according to the available data) and Abstracts Views on Vision4Press platform.
Data correspond to usage on the plateform after 2015. The current usage metrics is available 48-96 hours after online publication and is updated daily on week days.
Initial download of the metrics may take a while.