Fig. 7
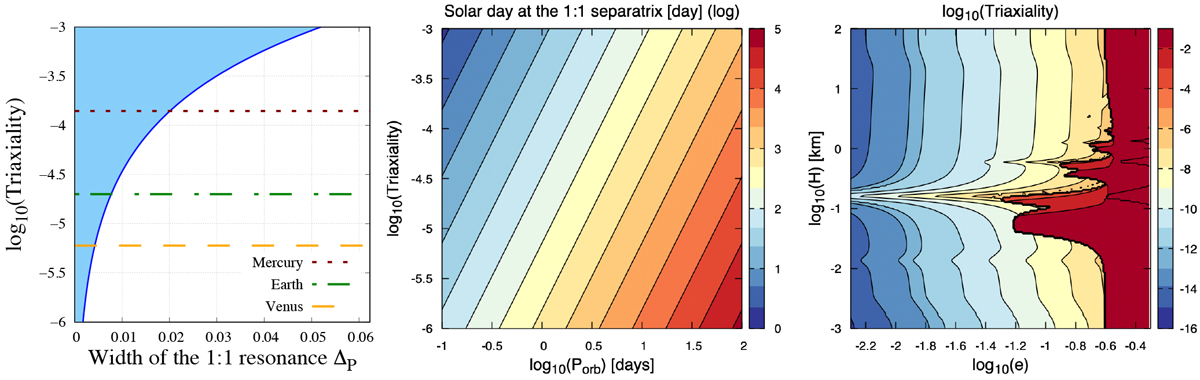
Left panel: normalised width of 1:1 spin-orbit resonance ![]() as a function of planet triaxiality. The blue zone shows the area covered by librations inside the resonance, which is the resonance width. Dotted and dashed brown, green and orange lines correspond to the triaxialities of Mercury (~ 1.4 × 10⁻⁴; Smith et al. 2012; Ribas et al. 2016), Earth (~2 × 10⁻⁵), and Venus (~6 × 10⁻⁶; Yoder 1995), respectively.Middle panel: solar day logarithm of planet at 1:1 resonance boundary as a function of its orbital period in Earth days (horizontal axis) and triaxiality (vertical axis) in logarithmic scales. Right panel: triaxiality logarithm. This is given such that the final asynchronous state of equilibrium of the planet corresponds to the width of the 1:1 spin-orbit resonance as a function of the eccentricity (horizontal axis) and ocean depth (vertical axis, km) of the planet in logarithmic scales. The treated case corresponds to the top middle panel of Fig. 6
(Mp = M⊕,
P⋆ = 6 days, and σR = 10−6 s−1).
as a function of planet triaxiality. The blue zone shows the area covered by librations inside the resonance, which is the resonance width. Dotted and dashed brown, green and orange lines correspond to the triaxialities of Mercury (~ 1.4 × 10⁻⁴; Smith et al. 2012; Ribas et al. 2016), Earth (~2 × 10⁻⁵), and Venus (~6 × 10⁻⁶; Yoder 1995), respectively.Middle panel: solar day logarithm of planet at 1:1 resonance boundary as a function of its orbital period in Earth days (horizontal axis) and triaxiality (vertical axis) in logarithmic scales. Right panel: triaxiality logarithm. This is given such that the final asynchronous state of equilibrium of the planet corresponds to the width of the 1:1 spin-orbit resonance as a function of the eccentricity (horizontal axis) and ocean depth (vertical axis, km) of the planet in logarithmic scales. The treated case corresponds to the top middle panel of Fig. 6
(Mp = M⊕,
P⋆ = 6 days, and σR = 10−6 s−1).
Current usage metrics show cumulative count of Article Views (full-text article views including HTML views, PDF and ePub downloads, according to the available data) and Abstracts Views on Vision4Press platform.
Data correspond to usage on the plateform after 2015. The current usage metrics is available 48-96 hours after online publication and is updated daily on week days.
Initial download of the metrics may take a while.