Fig. 7
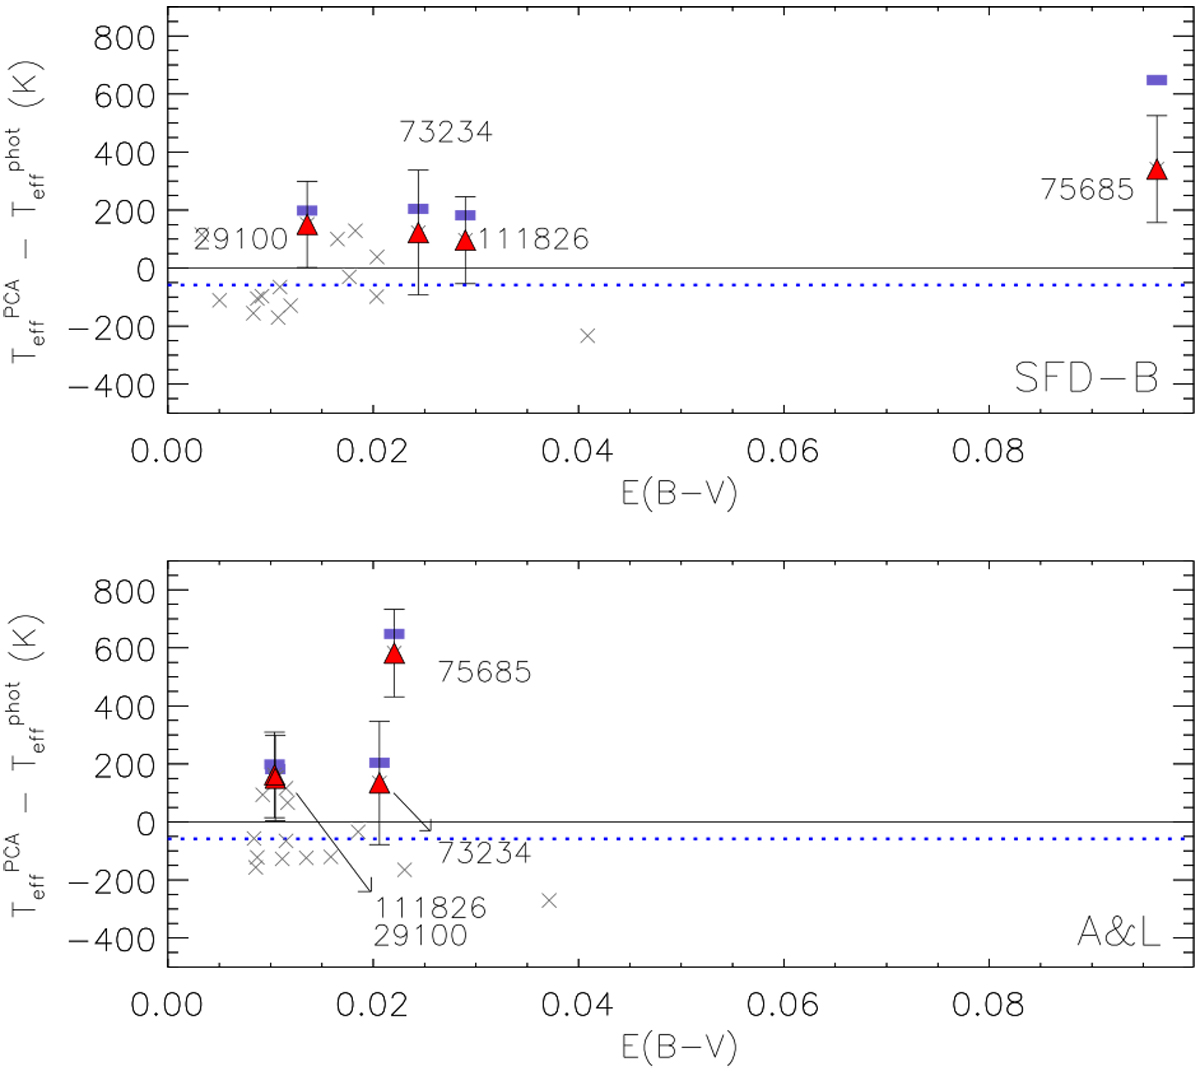
Difference between spectroscopic ![]() and dereddened
and dereddened ![]() of candidates according to the extinction models by SFD-B (top panel) and A&L (bottom panel). The stars with no significant differences are represented by crosses, and the others by the same symbols as in
Fig. 6. As a reference, temperature differences from undereddened colours are indicated by blue symbols, i.e. the same values as in Fig. 6. In both plots, the dotted lines at approximately
− 50 K represent the average
of candidates according to the extinction models by SFD-B (top panel) and A&L (bottom panel). The stars with no significant differences are represented by crosses, and the others by the same symbols as in
Fig. 6. As a reference, temperature differences from undereddened colours are indicated by blue symbols, i.e. the same values as in Fig. 6. In both plots, the dotted lines at approximately
− 50 K represent the average ![]() −
−
![]() of the stars represented by the crosses.
of the stars represented by the crosses.
Current usage metrics show cumulative count of Article Views (full-text article views including HTML views, PDF and ePub downloads, according to the available data) and Abstracts Views on Vision4Press platform.
Data correspond to usage on the plateform after 2015. The current usage metrics is available 48-96 hours after online publication and is updated daily on week days.
Initial download of the metrics may take a while.