Fig. 8.

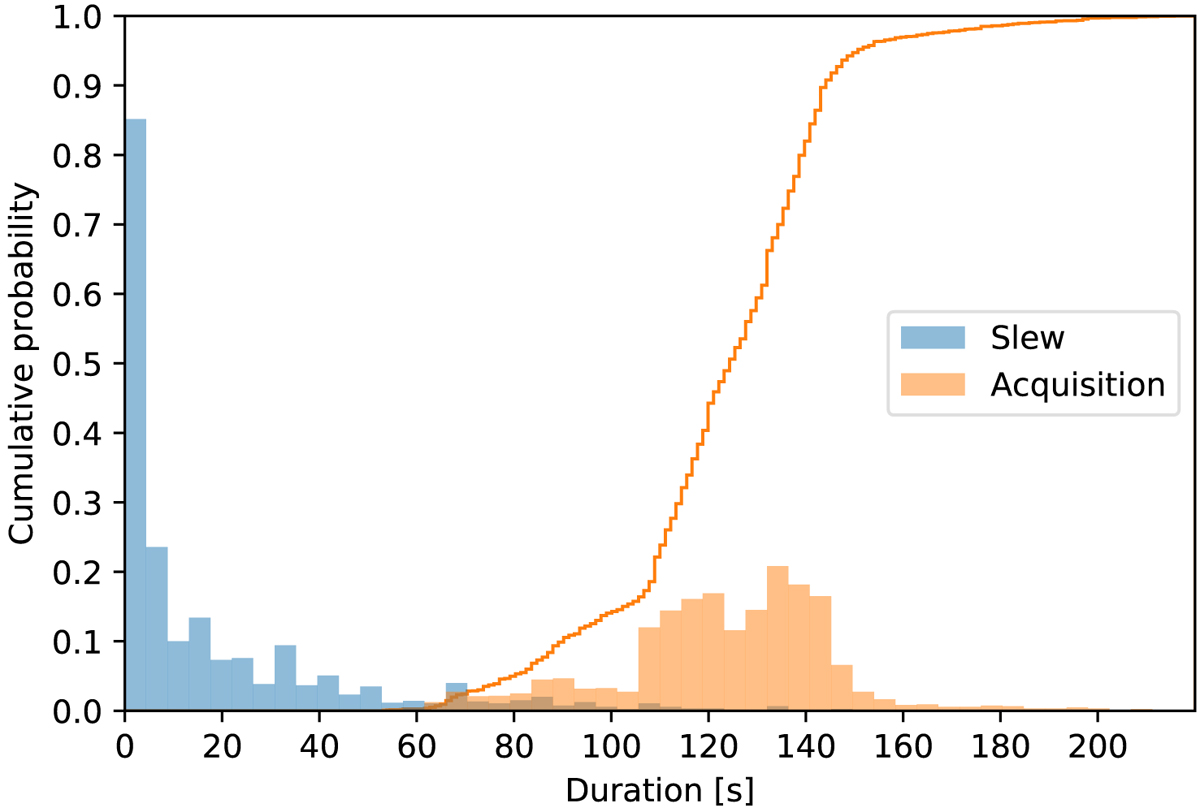
Laboratory-measured Strehl (top) and residual tilt (bottom) performance of NAOMI vs. WFS incident flux, at 80% seeing conditions, i.e. λ/r0 = 1.1″ and τ0 = 2.5 ms at λ = 500 nm. The former performance level of STRAP is also indicated. The coloured lines correspond to the performance measurements for each loop frequency (f), EM gain (g), loop gain (KI), and controlled mode (modes) settings. The coloured areas are the optimal settings for a given flux range. The WFS incident flux is converted into an R magnitude assuming a transmission to the WFS of 10%. The specifications for the Strehl and residual tilt vs. R magnitude are shown as black dots. The transitions between modes at 500 Hz were chosen based on saturation limits. The transition between modes at lower frequencies were chosen at a flux level two times higher than the Strehl performance intersections, to help with the stability of the AO loop close these transitions.
Current usage metrics show cumulative count of Article Views (full-text article views including HTML views, PDF and ePub downloads, according to the available data) and Abstracts Views on Vision4Press platform.
Data correspond to usage on the plateform after 2015. The current usage metrics is available 48-96 hours after online publication and is updated daily on week days.
Initial download of the metrics may take a while.


