Fig. A.2.
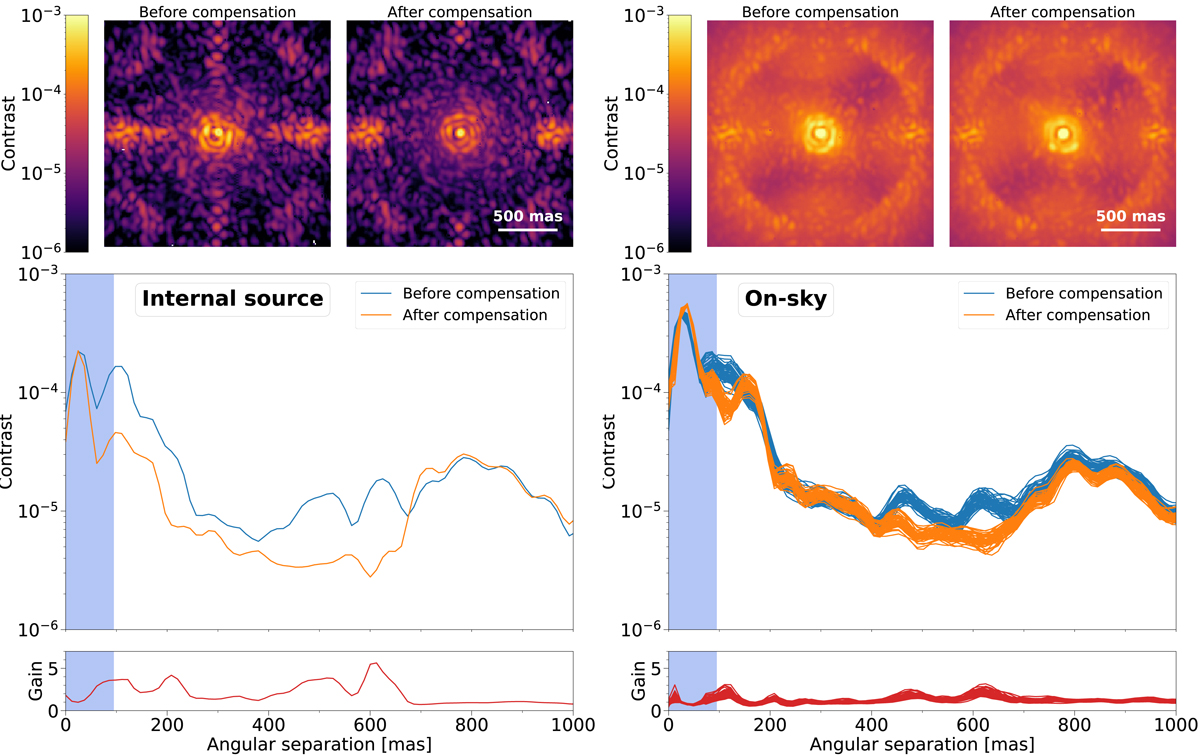
Coronagraphic images and profiles obtained on 2018-04-03 on the internal source (left, test CT03) and on sky (right, test CT04). Top row: coronagraphic images before and after NCPA compensation, main plots: azimuthal standard deviation profiles normalized to the off-axis PSF, and bottom plots: contrast gain after NCPA compensation. For on-sky measurements, a profile is shown for each individual coronagraphic image. The blue shadowed region shows the region masked by the focal-plane mask of the APLC.
Current usage metrics show cumulative count of Article Views (full-text article views including HTML views, PDF and ePub downloads, according to the available data) and Abstracts Views on Vision4Press platform.
Data correspond to usage on the plateform after 2015. The current usage metrics is available 48-96 hours after online publication and is updated daily on week days.
Initial download of the metrics may take a while.