Fig. A.1.
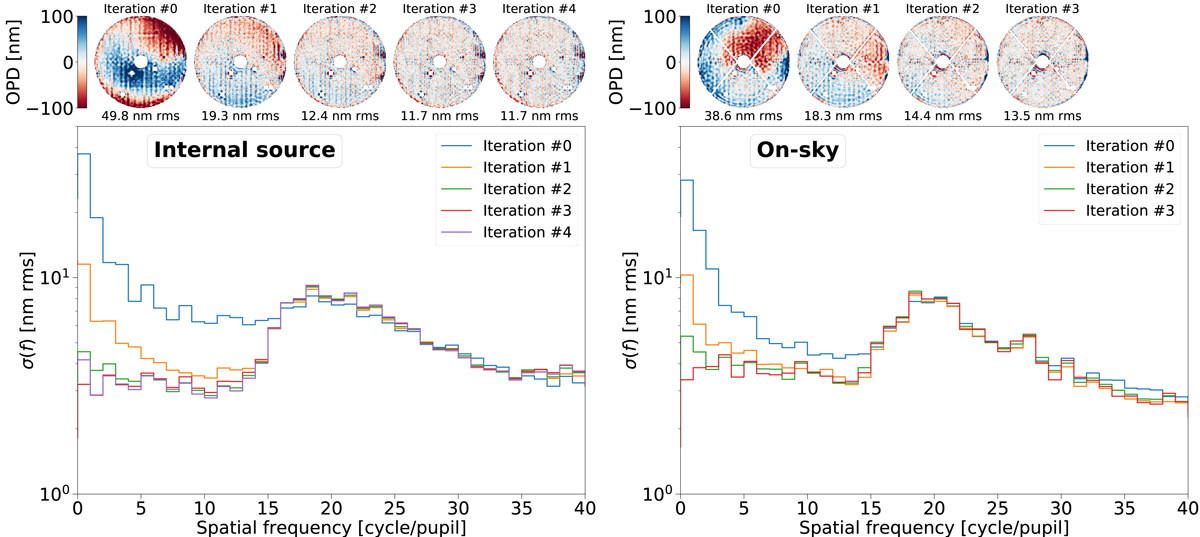
NCPA compensation loop results on 2018-04-03 on the internal source (left, test ZT03) and on sky (right, test ZT04). Top row: ZELDA OPD maps at the start (iteration #0) and at the subsequent iterations. The value reported below each OPD map corresponds to the amount of aberrations integrated in the range 1–15 c/p. Bottom plot: σ(f) of the OPD map at each iteration (see Sect. 3.2 for the σ(f) definition). In addition to the dead actuators and central part of the pupil that are always masked, the spiders are also masked for the on-sky test.
Current usage metrics show cumulative count of Article Views (full-text article views including HTML views, PDF and ePub downloads, according to the available data) and Abstracts Views on Vision4Press platform.
Data correspond to usage on the plateform after 2015. The current usage metrics is available 48-96 hours after online publication and is updated daily on week days.
Initial download of the metrics may take a while.