Fig. 7.
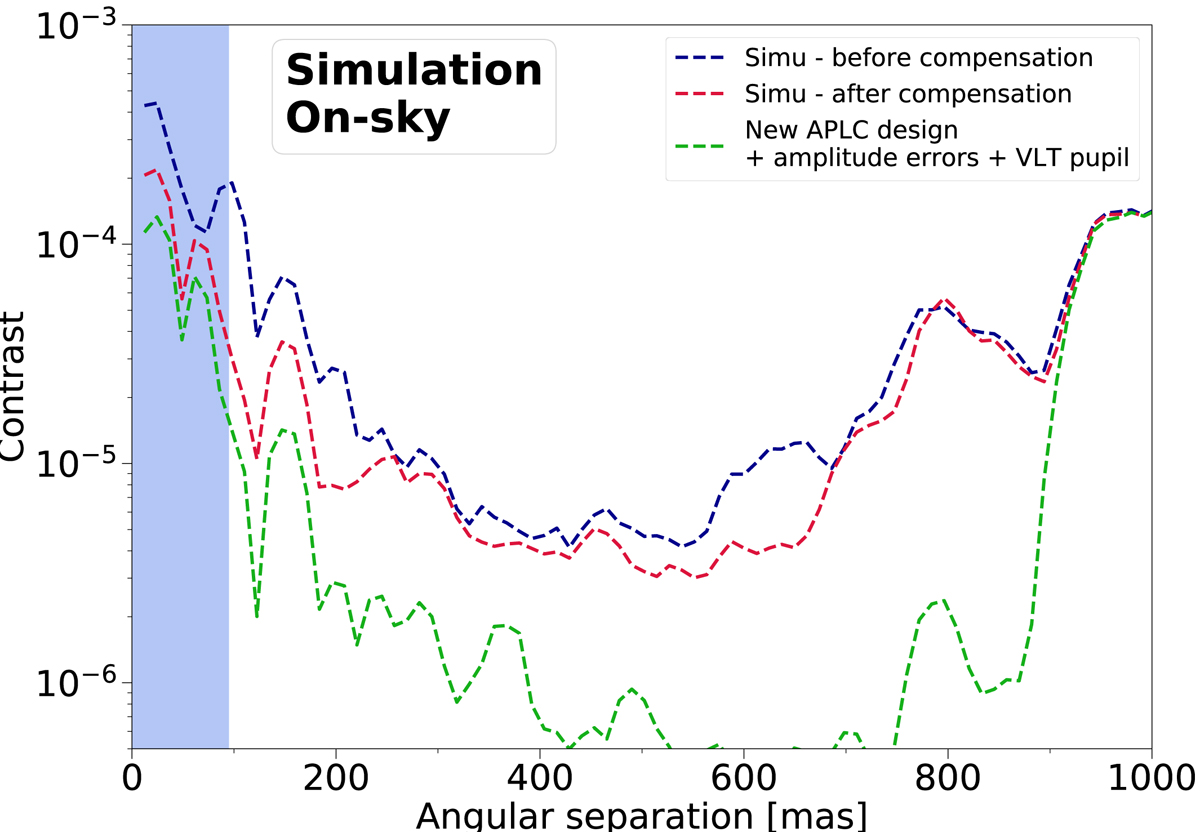
Expected raw-contrast performance on sky with a new apodizer design for the SPHERE APLC, before and after compensation of the NCPA. The design has been optimized to maximize the contrast in the 80–820 mas region (N’Diaye et al. 2016b). The theoretical performance of the APLC in the presence of amplitude errors is also plotted (dashed green curve). The coronagraphic image reconstruction includes ExAO residual wavefront errors reconstructed from SAXO real-time telemetry (see Appendix B). The blue shadowed region shows the region masked by the focal-plane mask of the APLC.
Current usage metrics show cumulative count of Article Views (full-text article views including HTML views, PDF and ePub downloads, according to the available data) and Abstracts Views on Vision4Press platform.
Data correspond to usage on the plateform after 2015. The current usage metrics is available 48-96 hours after online publication and is updated daily on week days.
Initial download of the metrics may take a while.