Fig. 6.
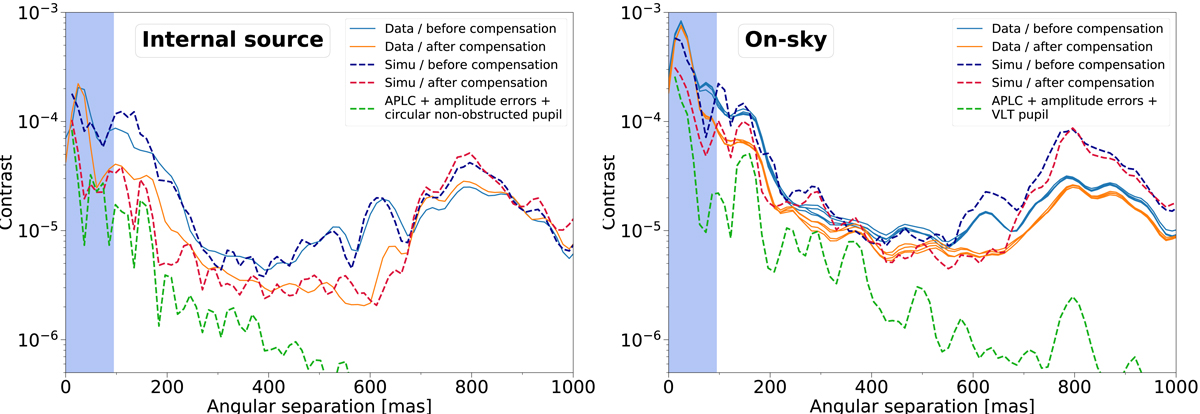
Comparison of the coronagraphic profiles acquired on 2018-04-01 on the internal source (left; test CT01) and on sky (right; test CT02) with coronagraphic image reconstruction based on realistic inputs (see Appendix C). The theoretical performance of the APLC in the presence of amplitude errors is also plotted (dashed green curve). For the on-sky data, the image reconstruction includes ExAO residual wavefront errors based on SAXO real-time telemetry (see Appendix B). The blue shadowed region shows the region masked by the focal-plane mask of the APLC.
Current usage metrics show cumulative count of Article Views (full-text article views including HTML views, PDF and ePub downloads, according to the available data) and Abstracts Views on Vision4Press platform.
Data correspond to usage on the plateform after 2015. The current usage metrics is available 48-96 hours after online publication and is updated daily on week days.
Initial download of the metrics may take a while.