Fig. 4.
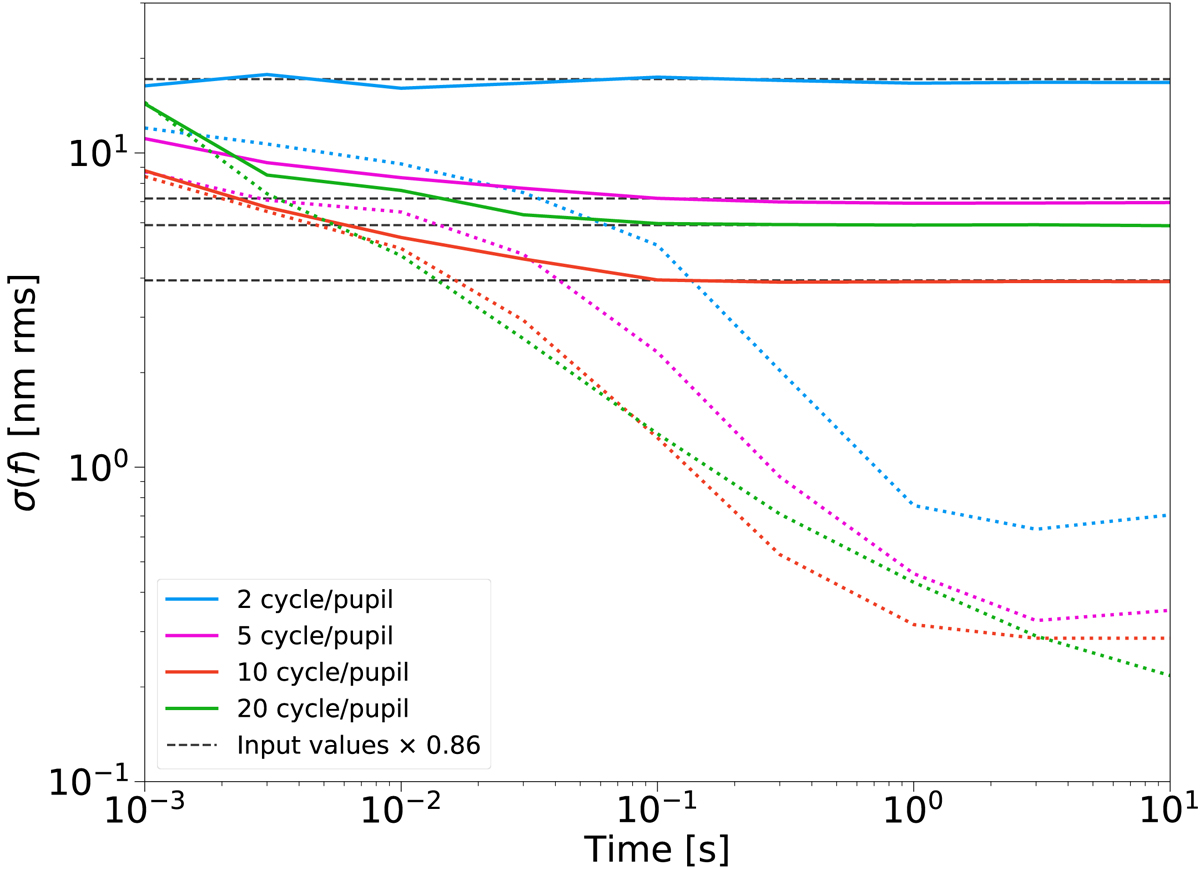
Influence of the integration time on the ZELDA reconstruction for 55 nm rms of NCPA and turbulence reconstructed from SAXO telemetry (plain lines), plotted at four different spatial frequencies. The dotted curves show the result of the reconstruction on pure atmospheric residuals, i.e., when setting the amount of NCPA to zero. The input values are corrected for the β = 0.86 sensitivity factor determined from simulation in Sect. 3.3.
Current usage metrics show cumulative count of Article Views (full-text article views including HTML views, PDF and ePub downloads, according to the available data) and Abstracts Views on Vision4Press platform.
Data correspond to usage on the plateform after 2015. The current usage metrics is available 48-96 hours after online publication and is updated daily on week days.
Initial download of the metrics may take a while.