Fig. 3.
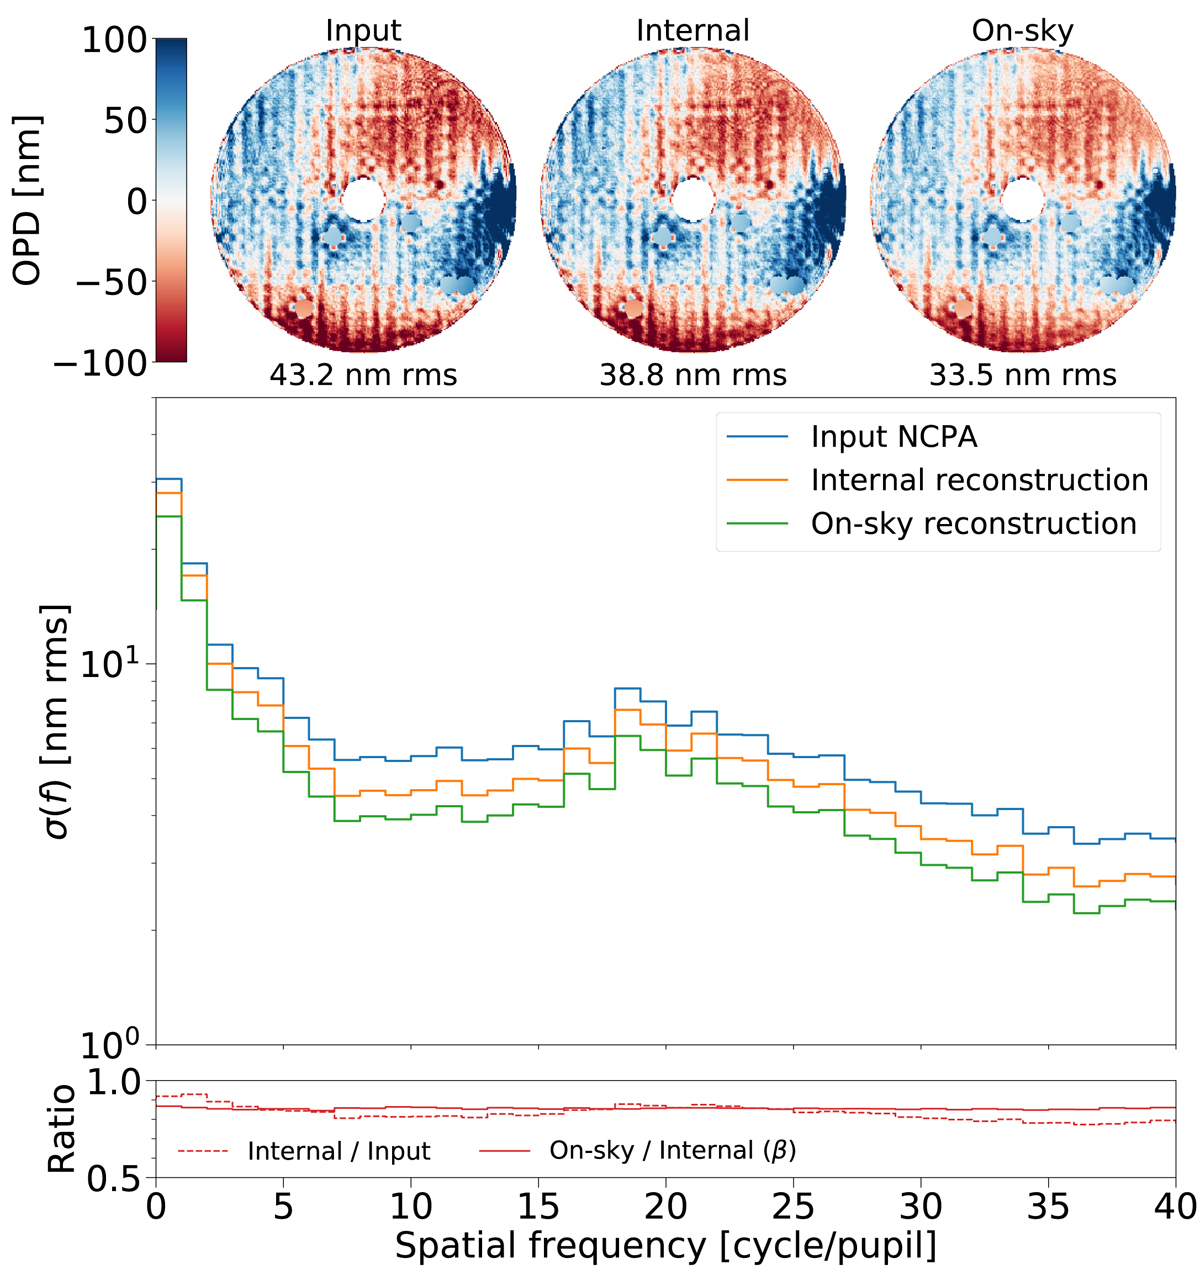
Numerical simulation of ZELDA wavefront reconstruction on the internal source and on sky, based on wavefront measurements from ZELDA and reconstructed ExAO residuals. Top row: OPD maps corresponding to the input NCPA injected into the simulation (left), the ZELDA-reconstructed NCPA on the internal source (center), and the ZELDA-reconstructed NCPA on sky (right). The amount of aberration integrated in the range 1–15 c/p is reported below each OPD map. Main plot: σ(f) of the three OPD maps, and bottom plot: ratio of the simulation input and the internal simulated reconstruction and of the on-sky and internal simulated reconstructions. The on-sky simulation is based on 30 s of SAXO real-time telemetry acquired during our tests in Paranal (see Sect. 3.3 and Appendix B). The tip, tilt, and focus have been subtracted to match the analysis of the real data shown in Fig. 2.
Current usage metrics show cumulative count of Article Views (full-text article views including HTML views, PDF and ePub downloads, according to the available data) and Abstracts Views on Vision4Press platform.
Data correspond to usage on the plateform after 2015. The current usage metrics is available 48-96 hours after online publication and is updated daily on week days.
Initial download of the metrics may take a while.