Fig. 2.
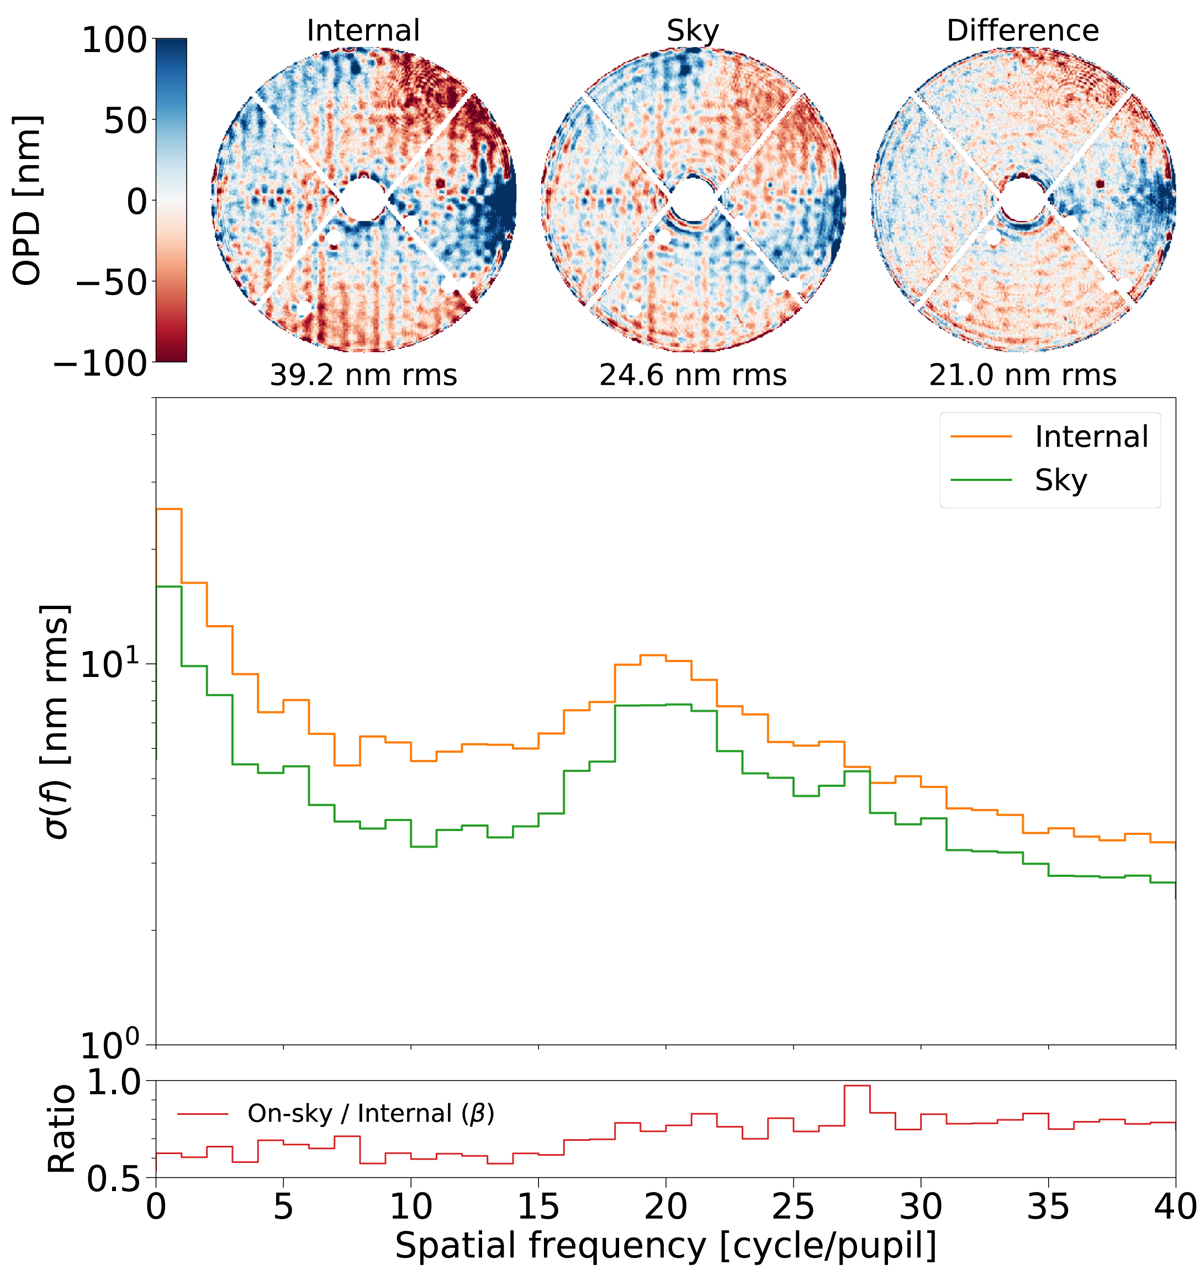
Comparison of the NCPA calibration performed on the internal source (left, test ZT06) and on sky (center, test ZT05). Top row: two OPD maps with the amount of aberration integrated in the range 1–15 c/p. Main plot: σ(f) of the two OPD maps, and bottom plot: ratio of the on-sky and internal measurements. In this test, NCPA was first measured on sky, and subsequently the instrument was switched to internal source without changing anything other than the source-selection mirror before another NCPA measurement was acquired. The tip, tilt, and focus have been subtracted (see Sect. 3.3), which explains why the amount of integrated aberration is smaller than in Fig. 1).
Current usage metrics show cumulative count of Article Views (full-text article views including HTML views, PDF and ePub downloads, according to the available data) and Abstracts Views on Vision4Press platform.
Data correspond to usage on the plateform after 2015. The current usage metrics is available 48-96 hours after online publication and is updated daily on week days.
Initial download of the metrics may take a while.