Open Access
Fig. C.2.
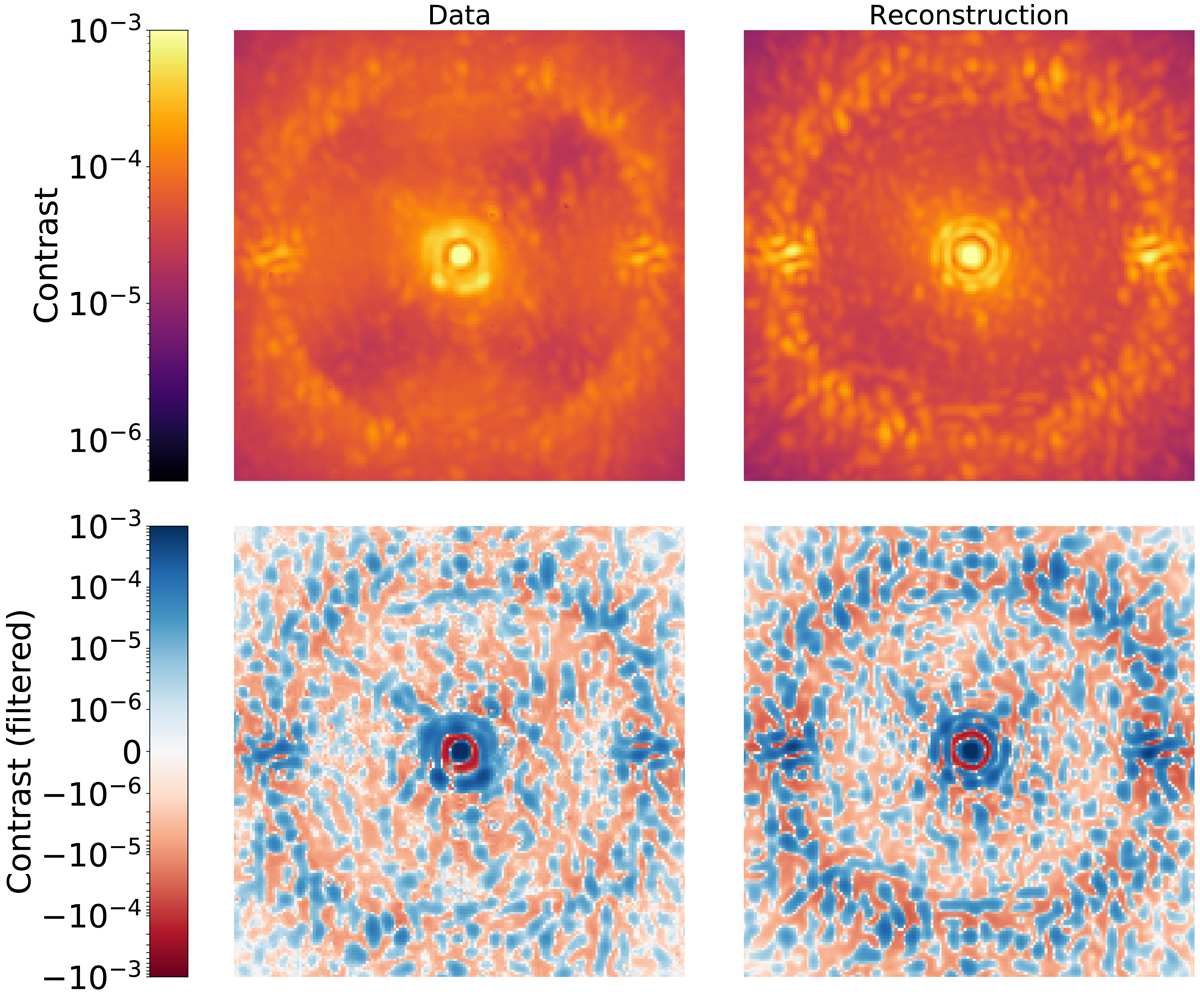
Comparison of the coronagraphic data obtained on sky on 2018-04-03 (left) with the reconstructed coronagraphic image (right). Top row: complete data and model, while bottom row: high-pass-filtered version of the images to remove the low-spatial frequencies corresponding to the averaged ExAO residuals.
Current usage metrics show cumulative count of Article Views (full-text article views including HTML views, PDF and ePub downloads, according to the available data) and Abstracts Views on Vision4Press platform.
Data correspond to usage on the plateform after 2015. The current usage metrics is available 48-96 hours after online publication and is updated daily on week days.
Initial download of the metrics may take a while.