Fig. 7.
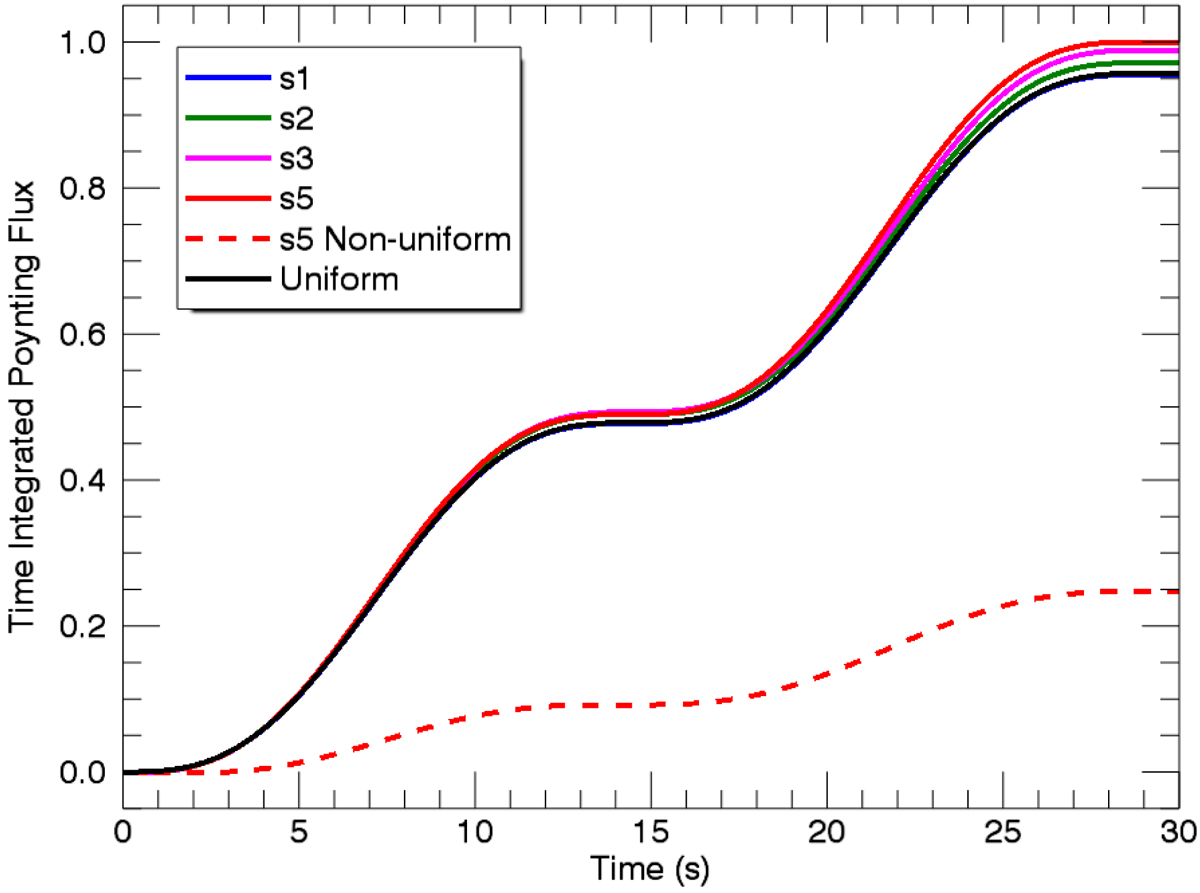
Energy injected into the domain by the wave driver. We display the time integral of the Poynting flux through the z = −50 Mm (lower) boundary for different initial conditions with the drivers described by Eqs. (7) and (9) (solid and dashed lines, respectively). Here we have normalised by the maximum of the s5 (solid red) curve.
Current usage metrics show cumulative count of Article Views (full-text article views including HTML views, PDF and ePub downloads, according to the available data) and Abstracts Views on Vision4Press platform.
Data correspond to usage on the plateform after 2015. The current usage metrics is available 48-96 hours after online publication and is updated daily on week days.
Initial download of the metrics may take a while.