Free Access
Fig. 23.
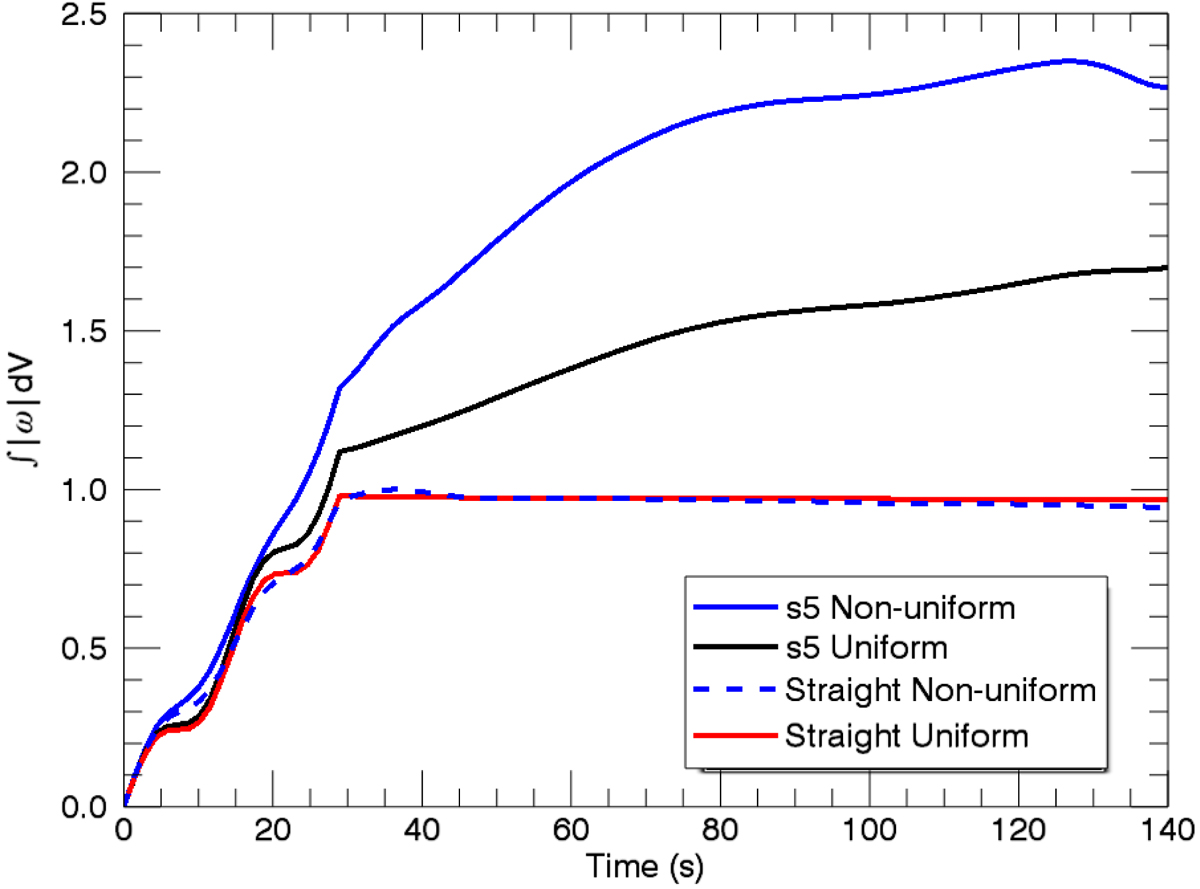
Volume integrated |ω| for the two forms of the wave driver in the s5 and straight field simulations. For the uniform driver cases, we have normalised by the maximum of the red curve. For the non-uniform driver cases, we have normalised by the maximum of the dashed blue curve.
Current usage metrics show cumulative count of Article Views (full-text article views including HTML views, PDF and ePub downloads, according to the available data) and Abstracts Views on Vision4Press platform.
Data correspond to usage on the plateform after 2015. The current usage metrics is available 48-96 hours after online publication and is updated daily on week days.
Initial download of the metrics may take a while.